Bernie and Jane Sanders after a victory speech in San Antonio, February 22, 2020 (AP / Eric Gay).
On Saturday, tens of thousands of Nevadans gathered in classrooms, libraries, and gyms to take part in one of only four mainland caucuses of the 2020 presidential race. While new party rules have slowed the reporting of caucus results, caucuses do have a distinct advantage over primaries, which are conducted by ballot: after an initial tally of candidates’ support, voters can realign themselves into new groups before the final count and avoid “wasting” their vote on an unviable candidate. This realignment process can provide valuable insight into the preferences of voters, and help us understand how the race might change if more candidates start to drop out.
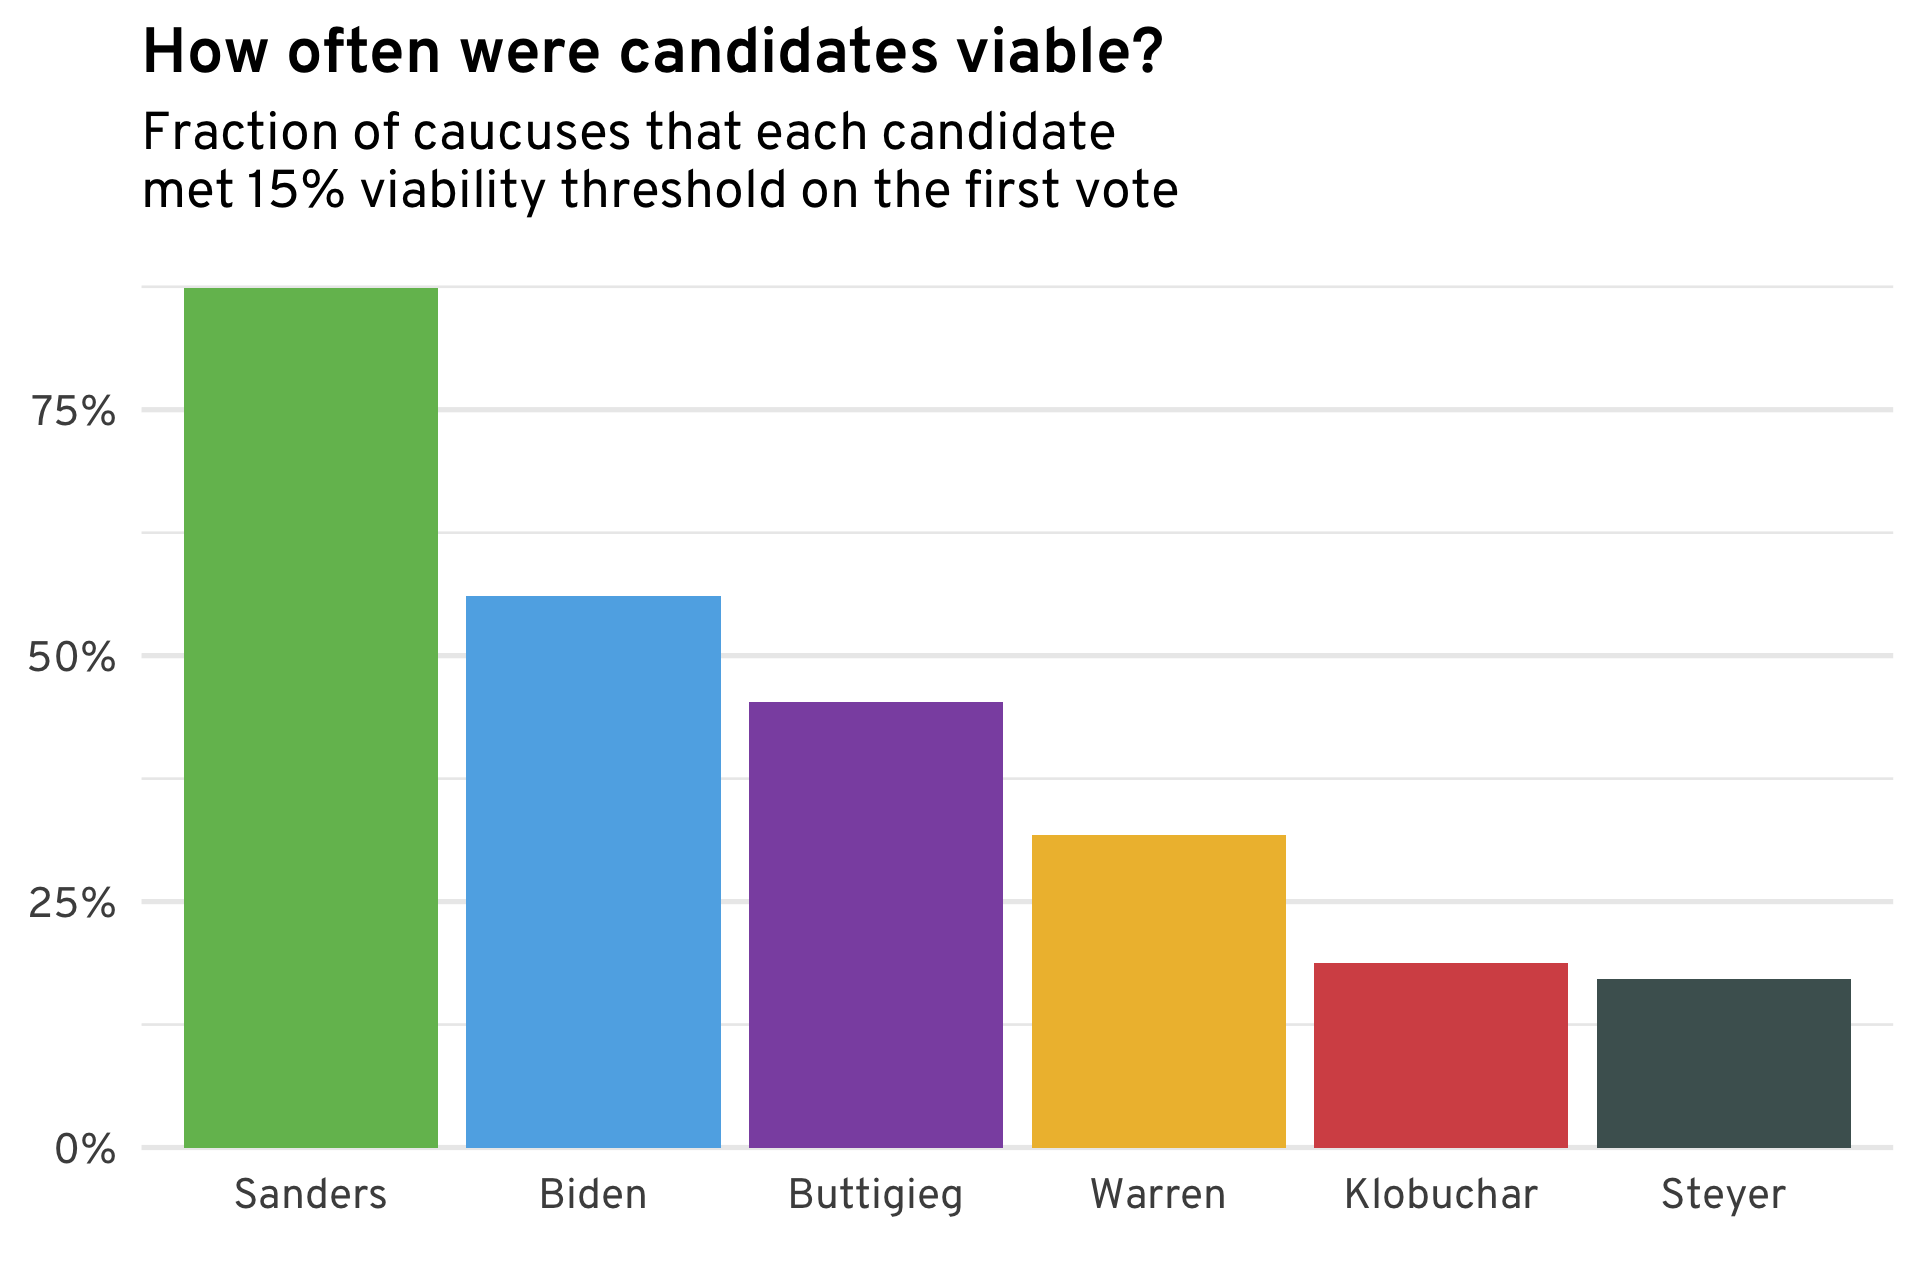
Not every voter can realign. After the first round of voting, candidates who don’t have at least 15% of the vote are deemed “unviable.” Supporters of unviable candidates can switch to caucus for viable candidates, or can try to join with supporters of other unviable candidates to make at least one of the unviable candidates viable again. Supporters of viable candidates cannot change their vote. (Words aren’t the best way to explain it; there are some great visuals that do much better.) The chart below shows the fraction of precincts that each candidate was viable at; Sanders leads the pack by a wide margin here, viable at over four in five precincts. (All data here come from the 88% of reporting precincts, as of Sunday night.)
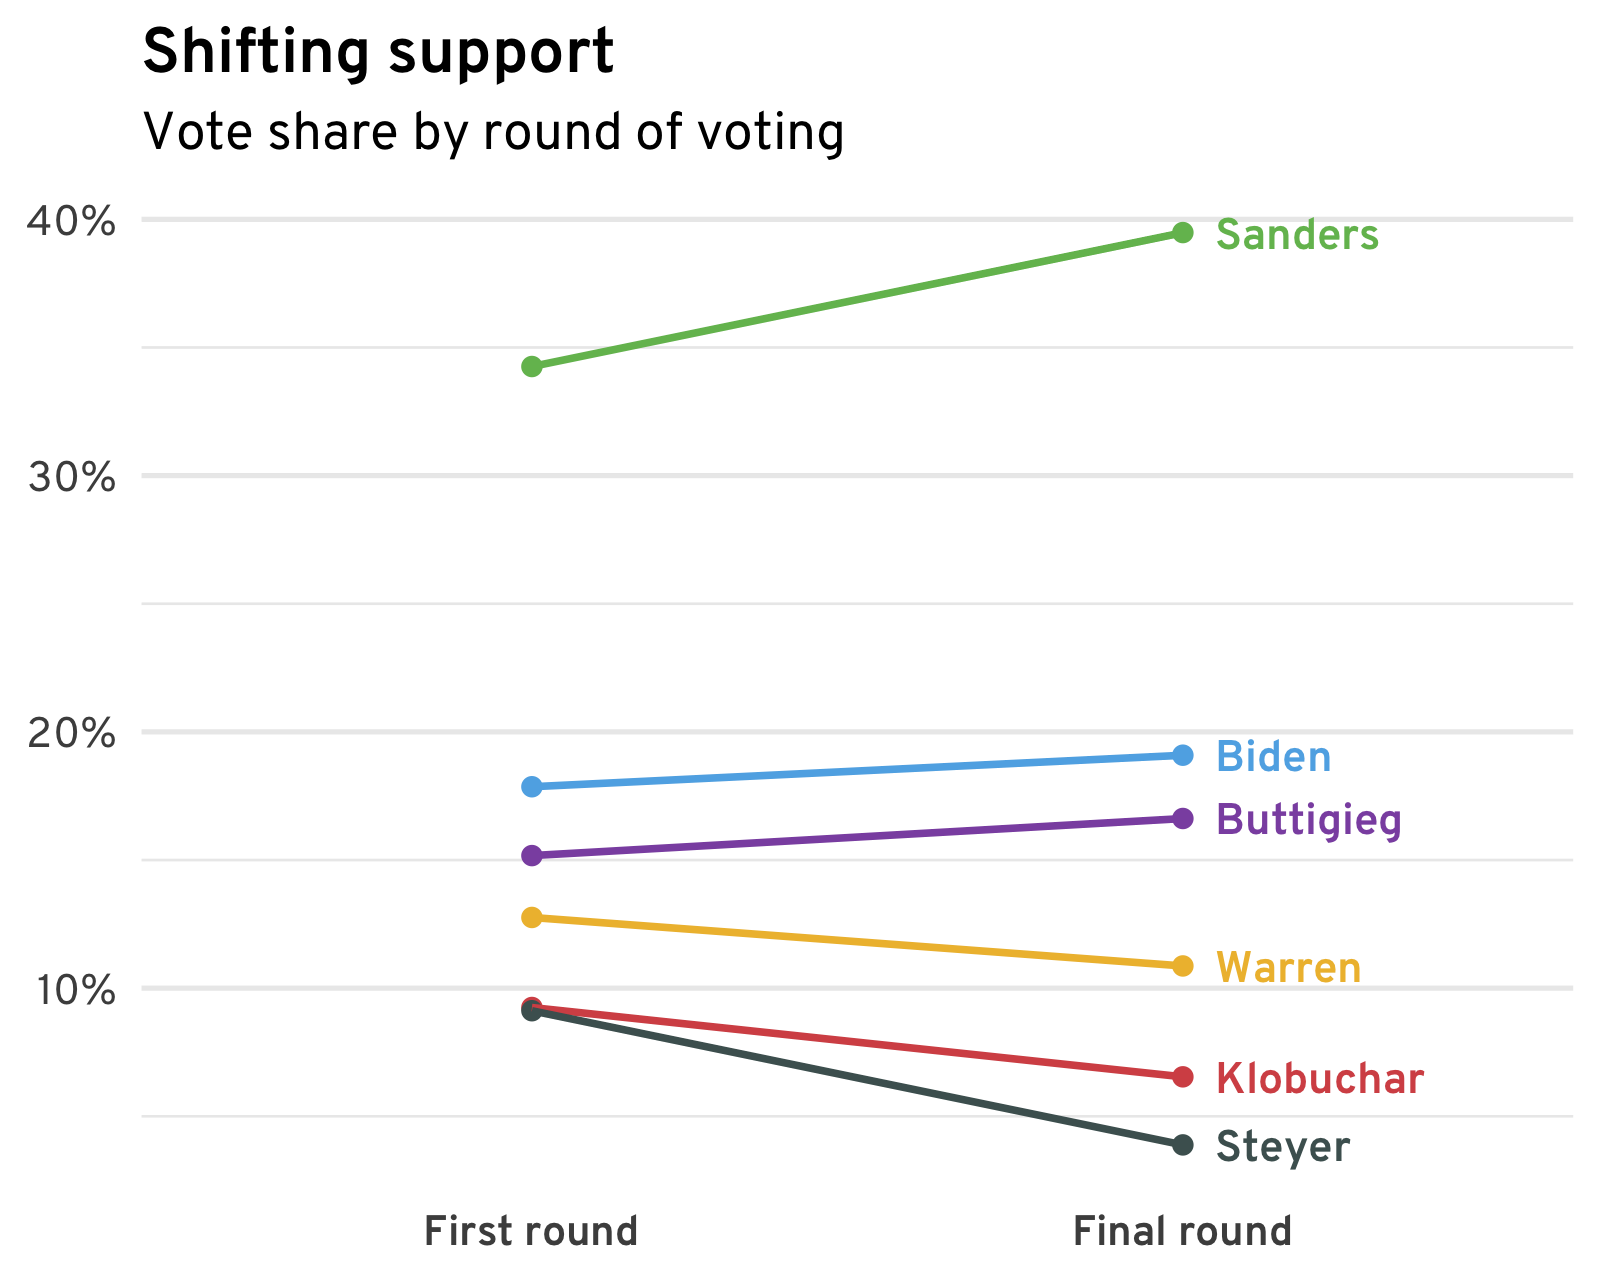
Each precinct reports the total number of votes at the first round and the final round after realignment, so we know which candidates gained or lost support. Across the whole state, Sanders, Biden, and Buttigieg gained support during the realignment phase, while the other candidates lost it (because they weren’t viable at most precincts). What we don’t know, however, is individual voters’ realignment choices. What kind of voters switched to Sanders? Were they Warren supporters? Biden supporters? A mix?
This is where statistics comes in. Given the large number of precincts, nearly every combination of viable and unviable candidates happened somewhere. This means that we can estimate which candidates voters switch to once their preferred candidate is no longer an option.
For example, if in Precinct A all candidates but Sanders and Biden are viable, but in Precinct B all candidates but Warren and Biden are viable, we can compare the realignment numbers between the precincts A and B to say something about how Biden voters realign themselves. (To do this, we have to make some assumptions.)
The results, shown below, are not too surprising. In places Sanders wasn’t viable, his supporters mostly went to Warren and Buttigieg. Where Klobuchar and Steyer weren’t viable, few of their supporters switched to Sanders. Supporters of minor candidates like Tulsi Gabbard or Michael Bennet overwhelmingly supported Buttigieg after realignment.
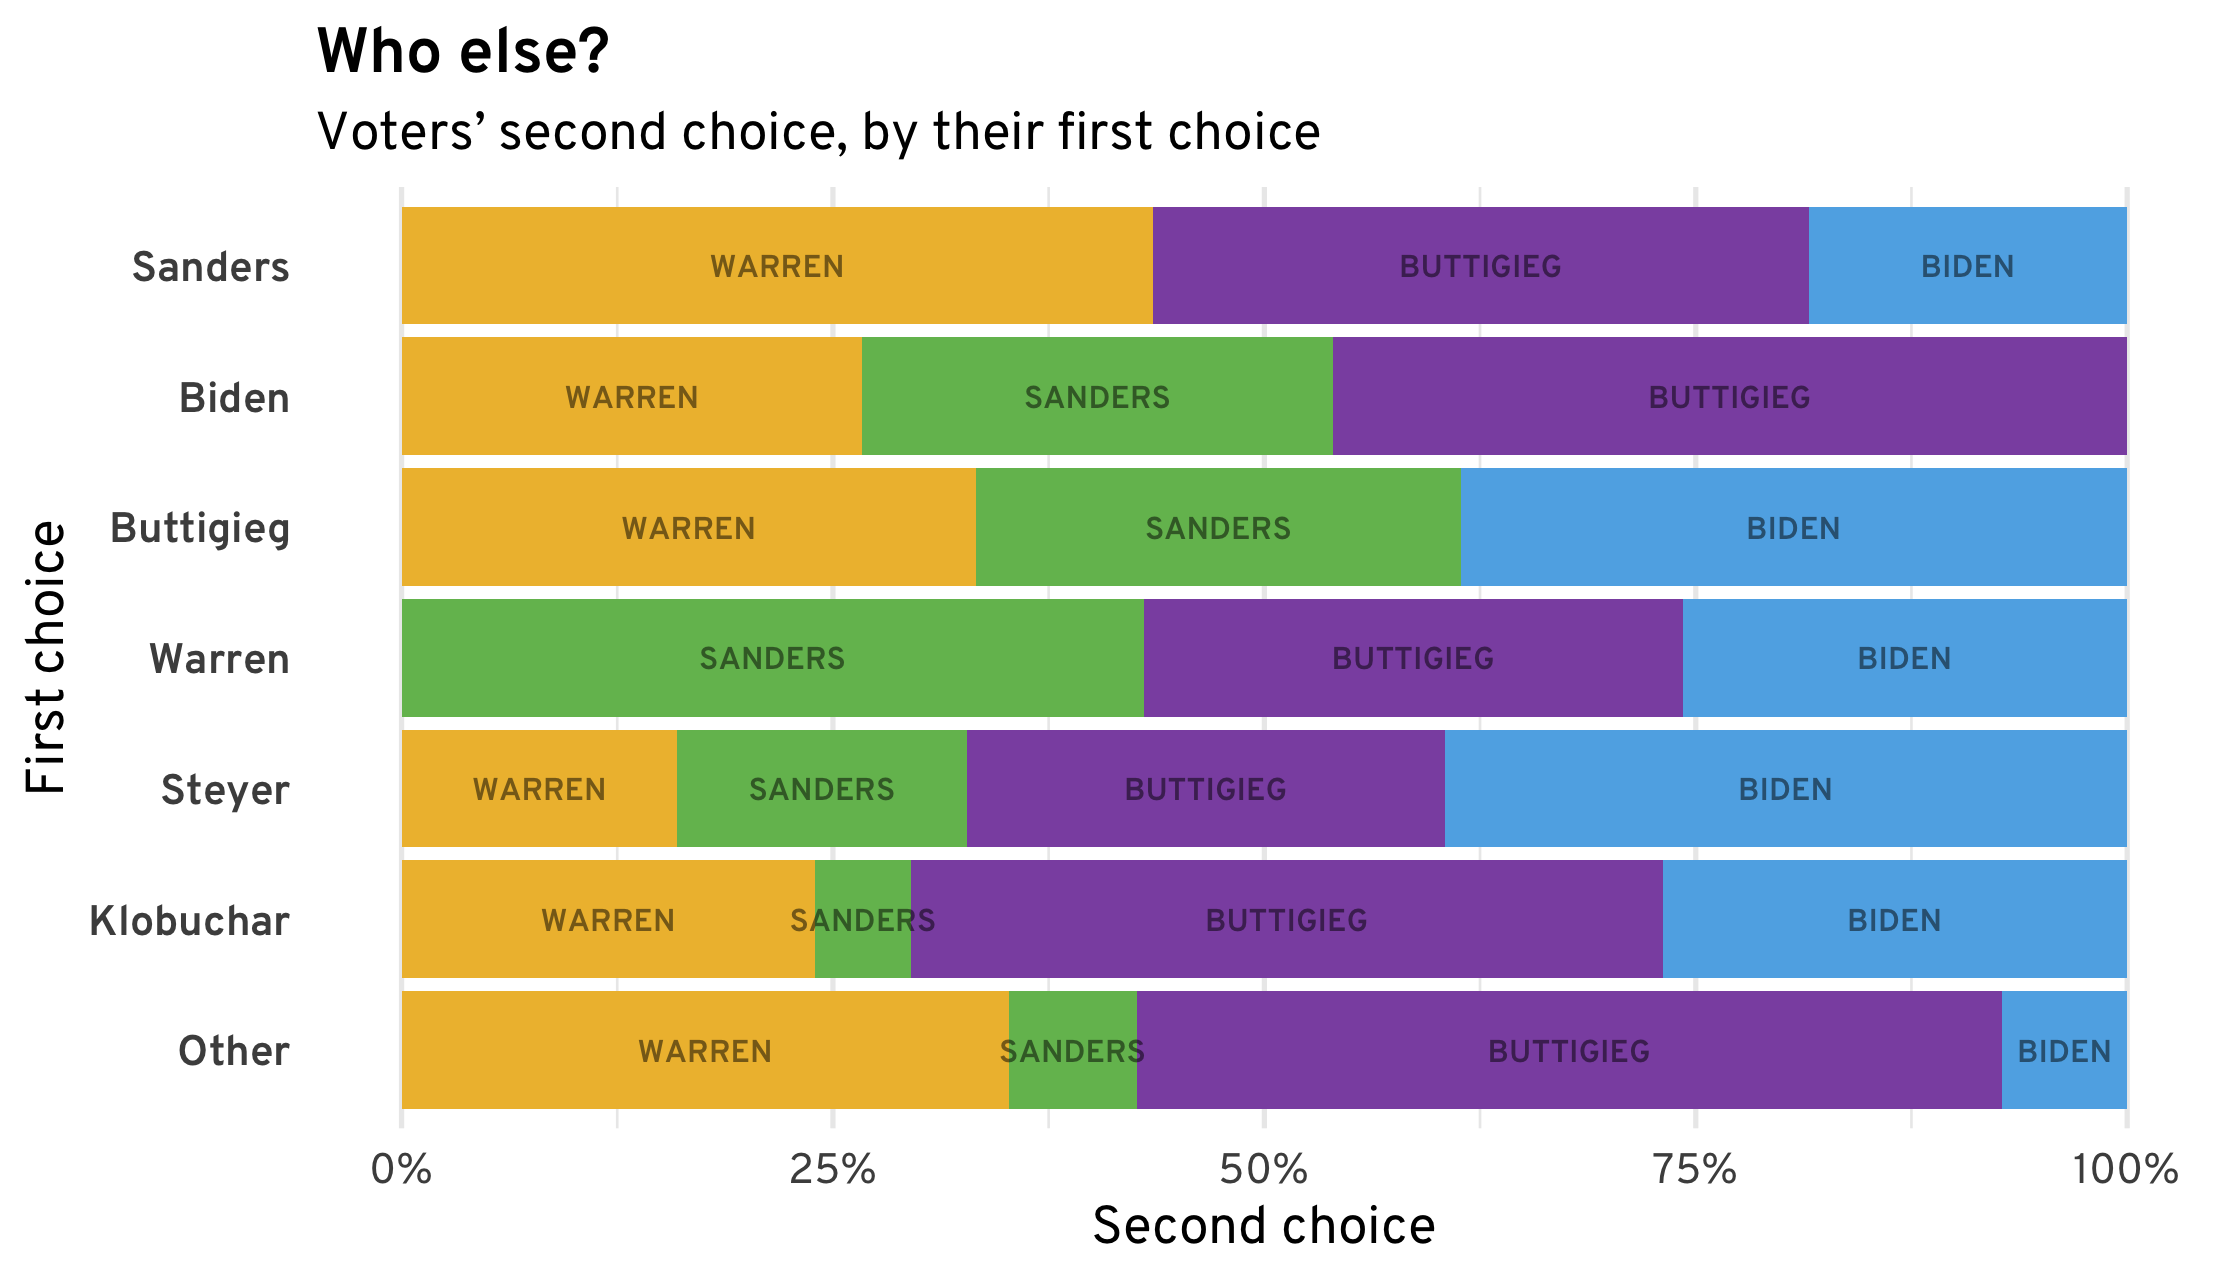
What may be surprising is how much variation there is. Candidates’ supporters aren’t a monolithic bloc, with similar second choices. Sanders’ supporters, for instance, appear to be equally likely to switch to Buttigieg or Warren, despite the major ideological differences between the two (and the similarities between Warren’s and Sanders’ platforms).
Importantly, since Bloomberg wasn’t on the ballot in Nevada, he doesn’t show up in any of these analyses. Past South Carolina, many voters’ second choice candidate would be Bloomberg, and so these results can only give a partial picture of the realignment dynamics.
But if we ignore Bloomberg for the moment, it’s natural to wonder what these preferences imply about how the race would change if a candidate were to drop out. The chart below shows each possibility.
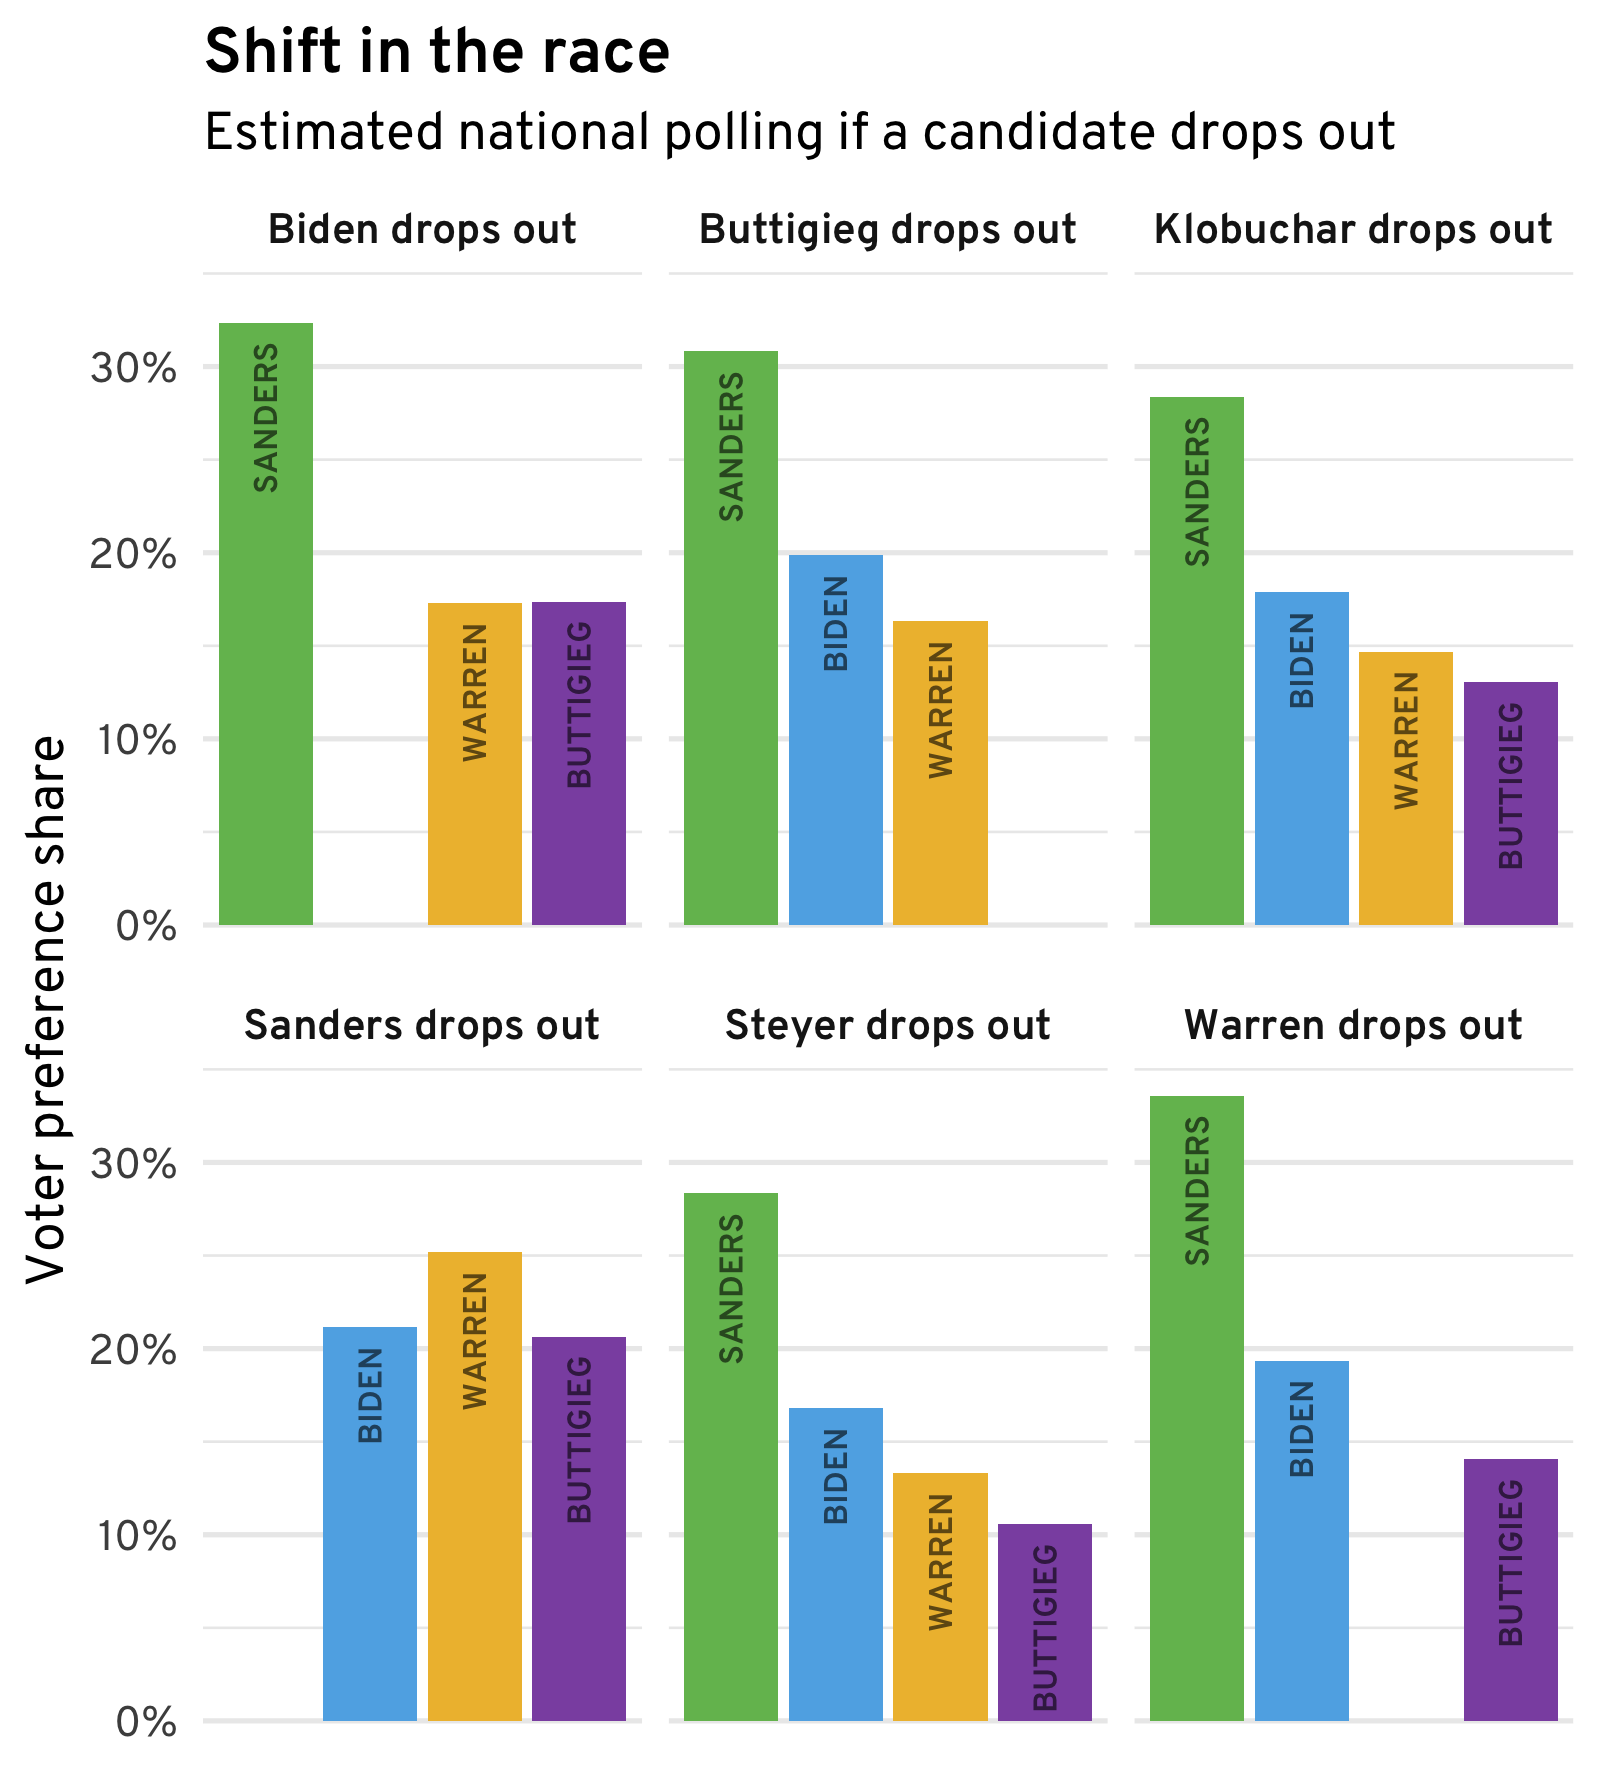
Even if one of the leading centrists drops out, their voters wouldn’t migrate to the other centrists in enough numbers to push any centrist above Sanders. But if Sanders were to drop out, it appears that Warren would be able to take the lead in the national race.
Of course, estimates like these are incredibly speculative, even ignoring the absence of Bloomberg. A race in which Sanders drops out but Warren does not would likely be a very different one, and the preferences of Nevada voters shouldn’t be considered very informative.
Nevertheless, the few caucuses in this race, and their viability threshold and subsequent realignments, provide unique insight into voters’ preferences beyond their first choice. Pollsters can and do ask questions to probe at this, but these questions are speculative in a way that caucuses are not—at a caucus, voters must choose a new candidate to support if theirs is eliminated. The results from Nevada underscore both Sanders’ strength and also the fluidity of the race. Voters’ second choices don’t clearly fall along ideological lines. No one knows what will happen when candidates start to leave the race.
Assumptions
To estimate realignments, we have to assume that supporters of one unviable candidate realign themselves independent of how the supporters of another unviable candidate realign themselves. We also have to assume that supporters of a candidate at a precinct where that candidate isn’t viable don’t have different preferences than supporters of that candidate at a precinct where they are viable.
Neither of these assumptions holds exactly, and the first one in particular is questionable if there is a lot of horse-trading and strategic realignment, which can happen at some caucuses. For that reason, we exclude all caucus locations where a candidate who is not viable in the first round becomes viable again in the second round (around 300 precincts). The hope is that, once we exclude places where voters are demonstrably acting strategically, these assumptions are a reasonable approximation of reality. (There are other things we can do to probe these assumptions, but they take more time and computational resources than I had available.)