
San Francisco in fog, July 2019.
On September 5, 1997, Los Angeles set a city record for the most consecutive days without any rain: 198. Just last month, Seattle set a city record for having had rain every single day in January, except New Year’s Day.
These streaks highlight an important part of how we experience a place’s weather: it matters not just how hot it gets, or how much it rains, but also how long these kinds of weather stick around. Thus Mark Twain’s famous quote: “If you don’t like the weather in New England now, just wait a few minutes.”
Mathematically, one way to understand these patterns is through Markov chains, which are a fancy way of talking about the picture below. Suppose we live in Pleasantville, USA, and it’s sunny today. Tomorrow, there’s a 70% chance it will still be sunny, and a 30% chance it will rain. If it does rain tomorrow, then there’s a 40% chance it will rain again the day after that, and a 60% chance it will go back to being sunny. You can imagine your finger tracing out the weather pattern along the arrows.

Thinking of weather as a Markov chain gives us a lot of tools to understand its behavior. For example, we can calculate how often it will be sunny or rainy, and we can estimate how likely we are to have 198 days of sun in a row. Now—news flash!—the weather changes throughout the year, so we have to think about the probabilities in the diagram above as changing from day to day. Sunny streaks are more likely during the summer.
But if we allow for these changes, and we look at not just sun and rain but also clouds and snow, we can start to get an interesting picture of the weather in a place. The next section shows what happens when we use a statistical model to do this for the largest fifteen or so cities in the U.S. Try picking different cities in the drop-down menu and explore how their weather patterns differ.
[Jump to the second half] [Jump to the methodology section]
How often is it sunny in February? Snowy in September? The chart below shows how the mix of weather in Seattle varies throughout the year. Hover over it to see a more detailed breakdown.
Once we've estimated the Markov chain of Seattle ’s weather, we can use it to figure out how long streaks of certain kinds of weather should last. And we can average these out across the four kinds of weather to arrive at a single number which summarizes how “persistent” Seattle’s weather is: does it change every day, or does it stick around for weeks at a time?
Finally, we can fully describe a Markov chain by its transition matrix, which lists the chances of going from one kind of weather to another—the numbers along each of the arrows in the diagram above. The chart below visualizes the transition matrix for Seattle; hover over a rectangle to see the chances of going from one kind of weather today to another kind tomorrow. Use the date slider at the bottom to see how these numbers change throughout the year.
Comparing Cities
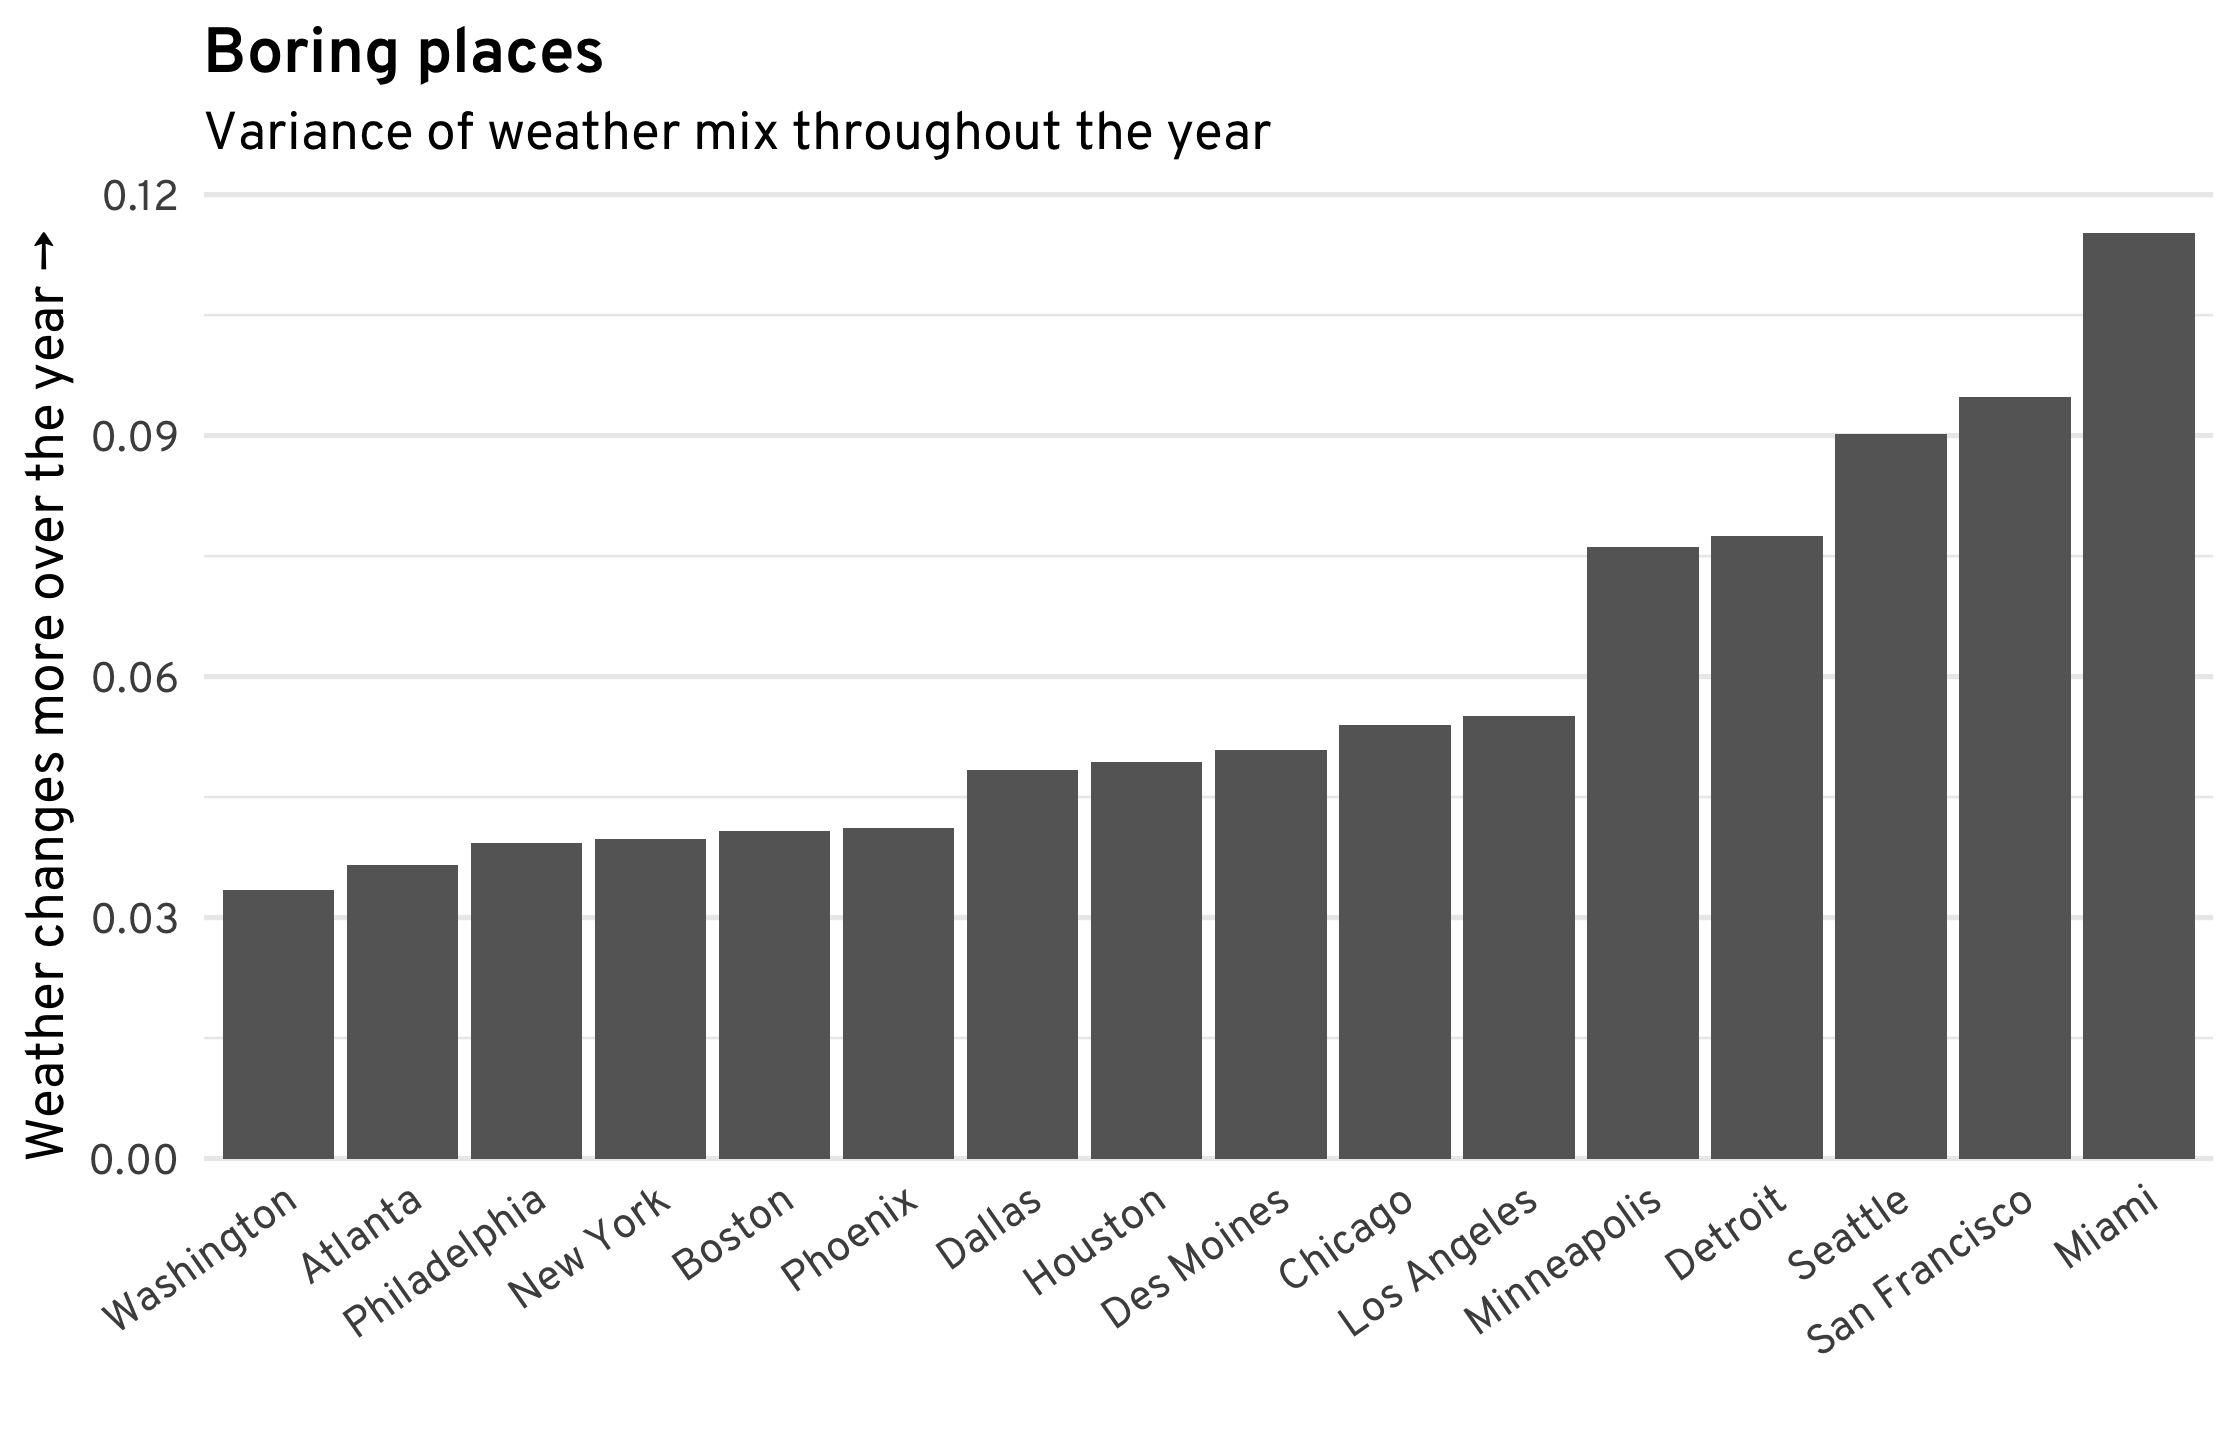
One way in which cities differ is in how much their weather changes throughout the year—how “squiggly” the weather mix diagram from above is, to be precise. The figure below tries to measure this. Most East Coast cities have a broadly similar mix of sun and rain throughout the year. In contrast, cities like Miami, San Francisco, and Seattle have more clearly defined sunny and rainy seasons. (This is somewhat related to this excellent article about the predictability of weather across the U.S.)
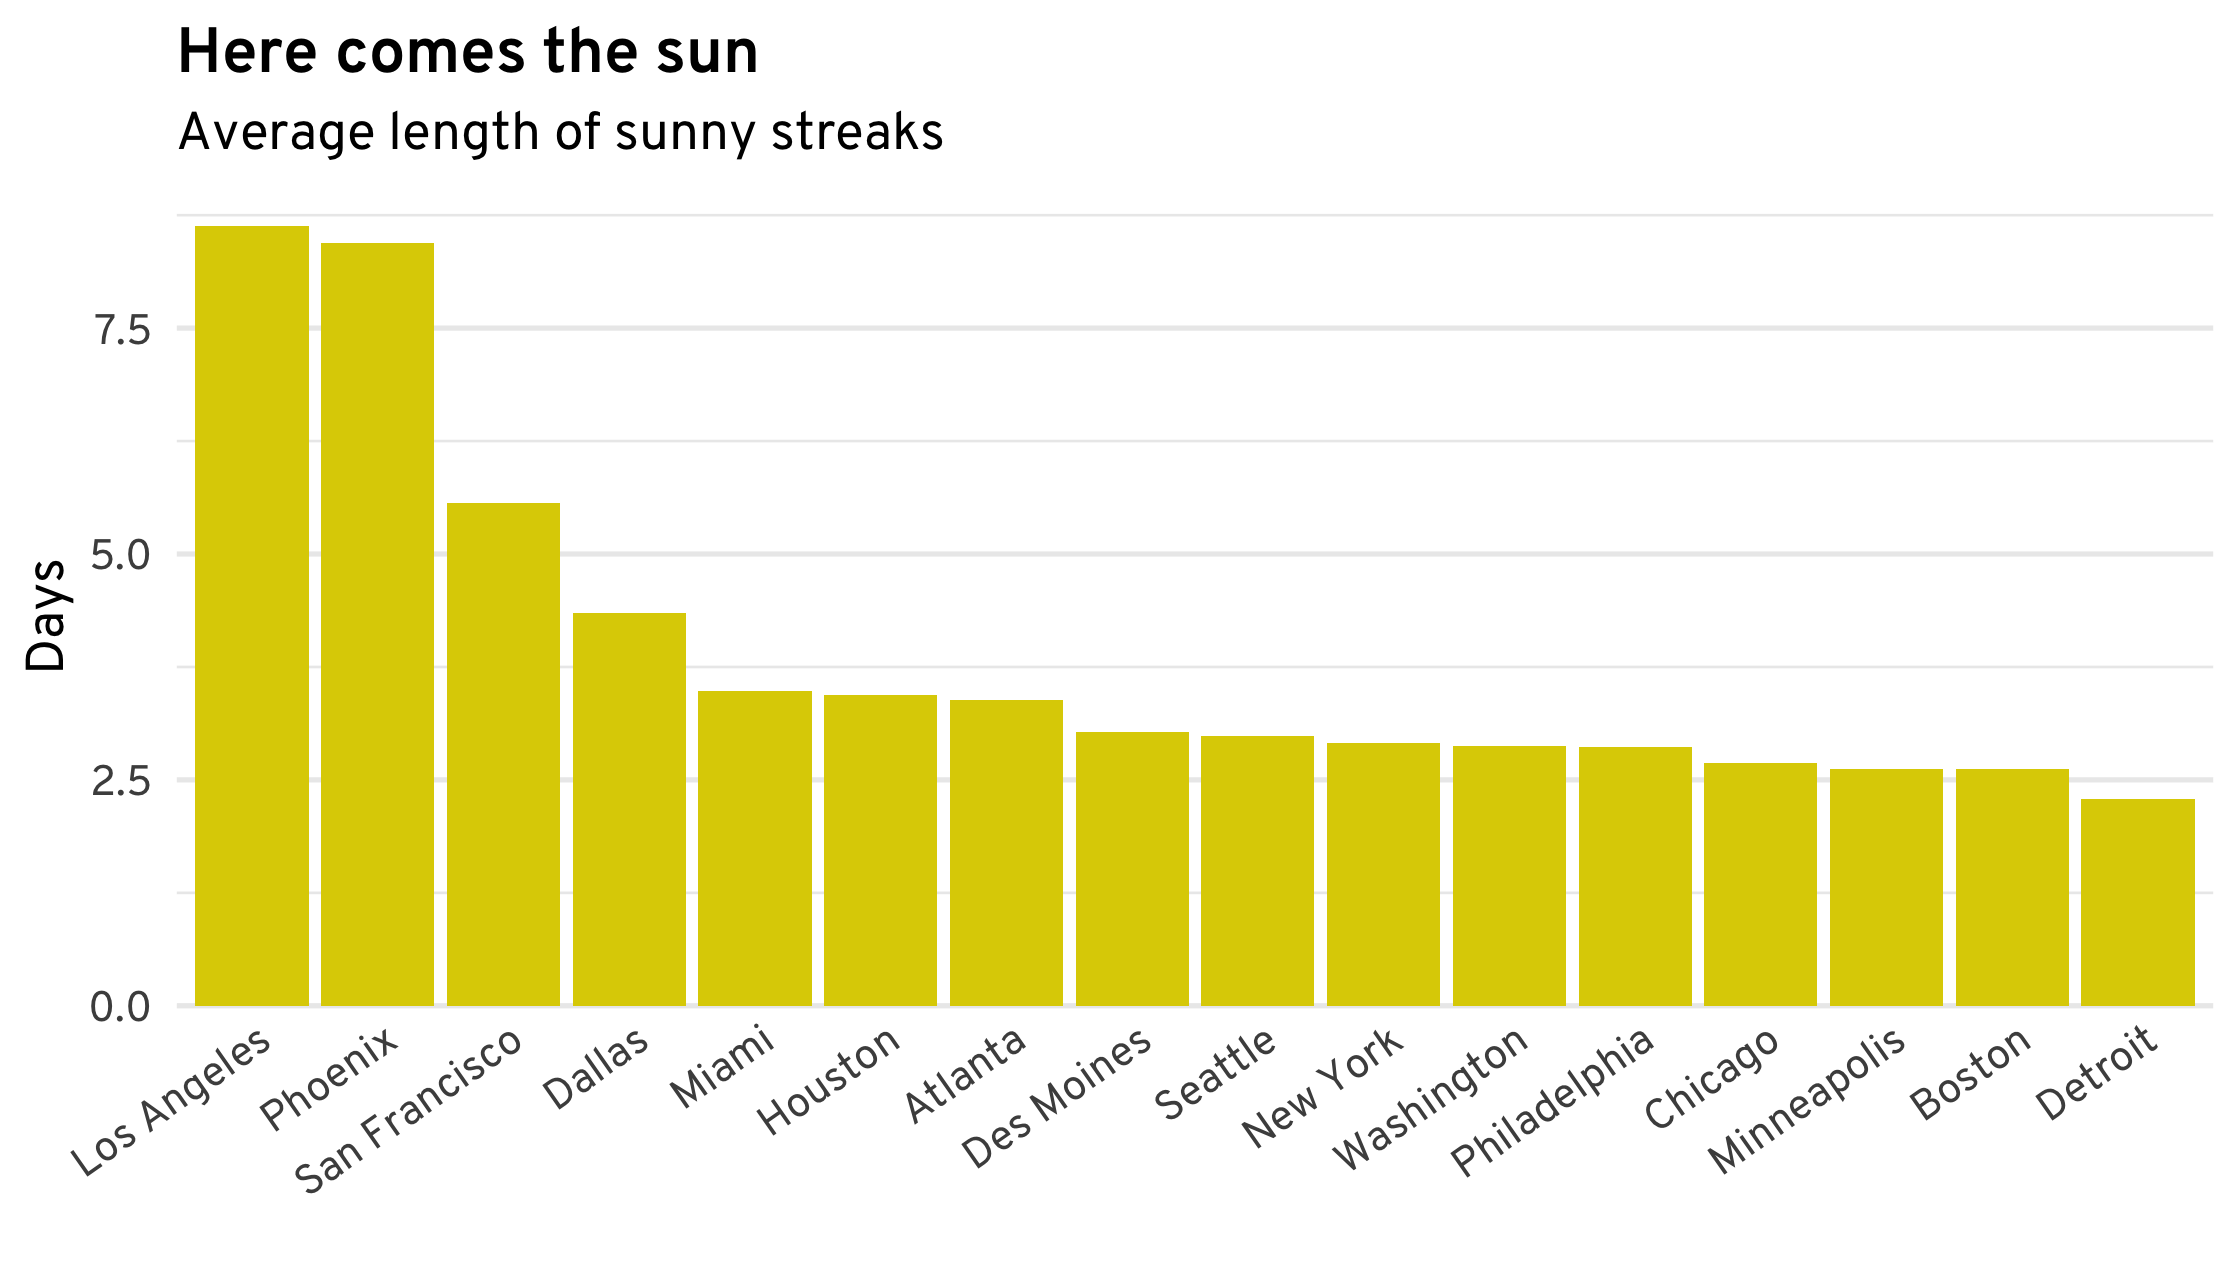
Other patterns are rather predictable. Ranking cities by the average length of their sunny streaks yields, predictably, cities in the South and West. Slightly less predictable is that Seattle’s sunny streaks are about as long as those of most cities in the Northeast and Midwest.
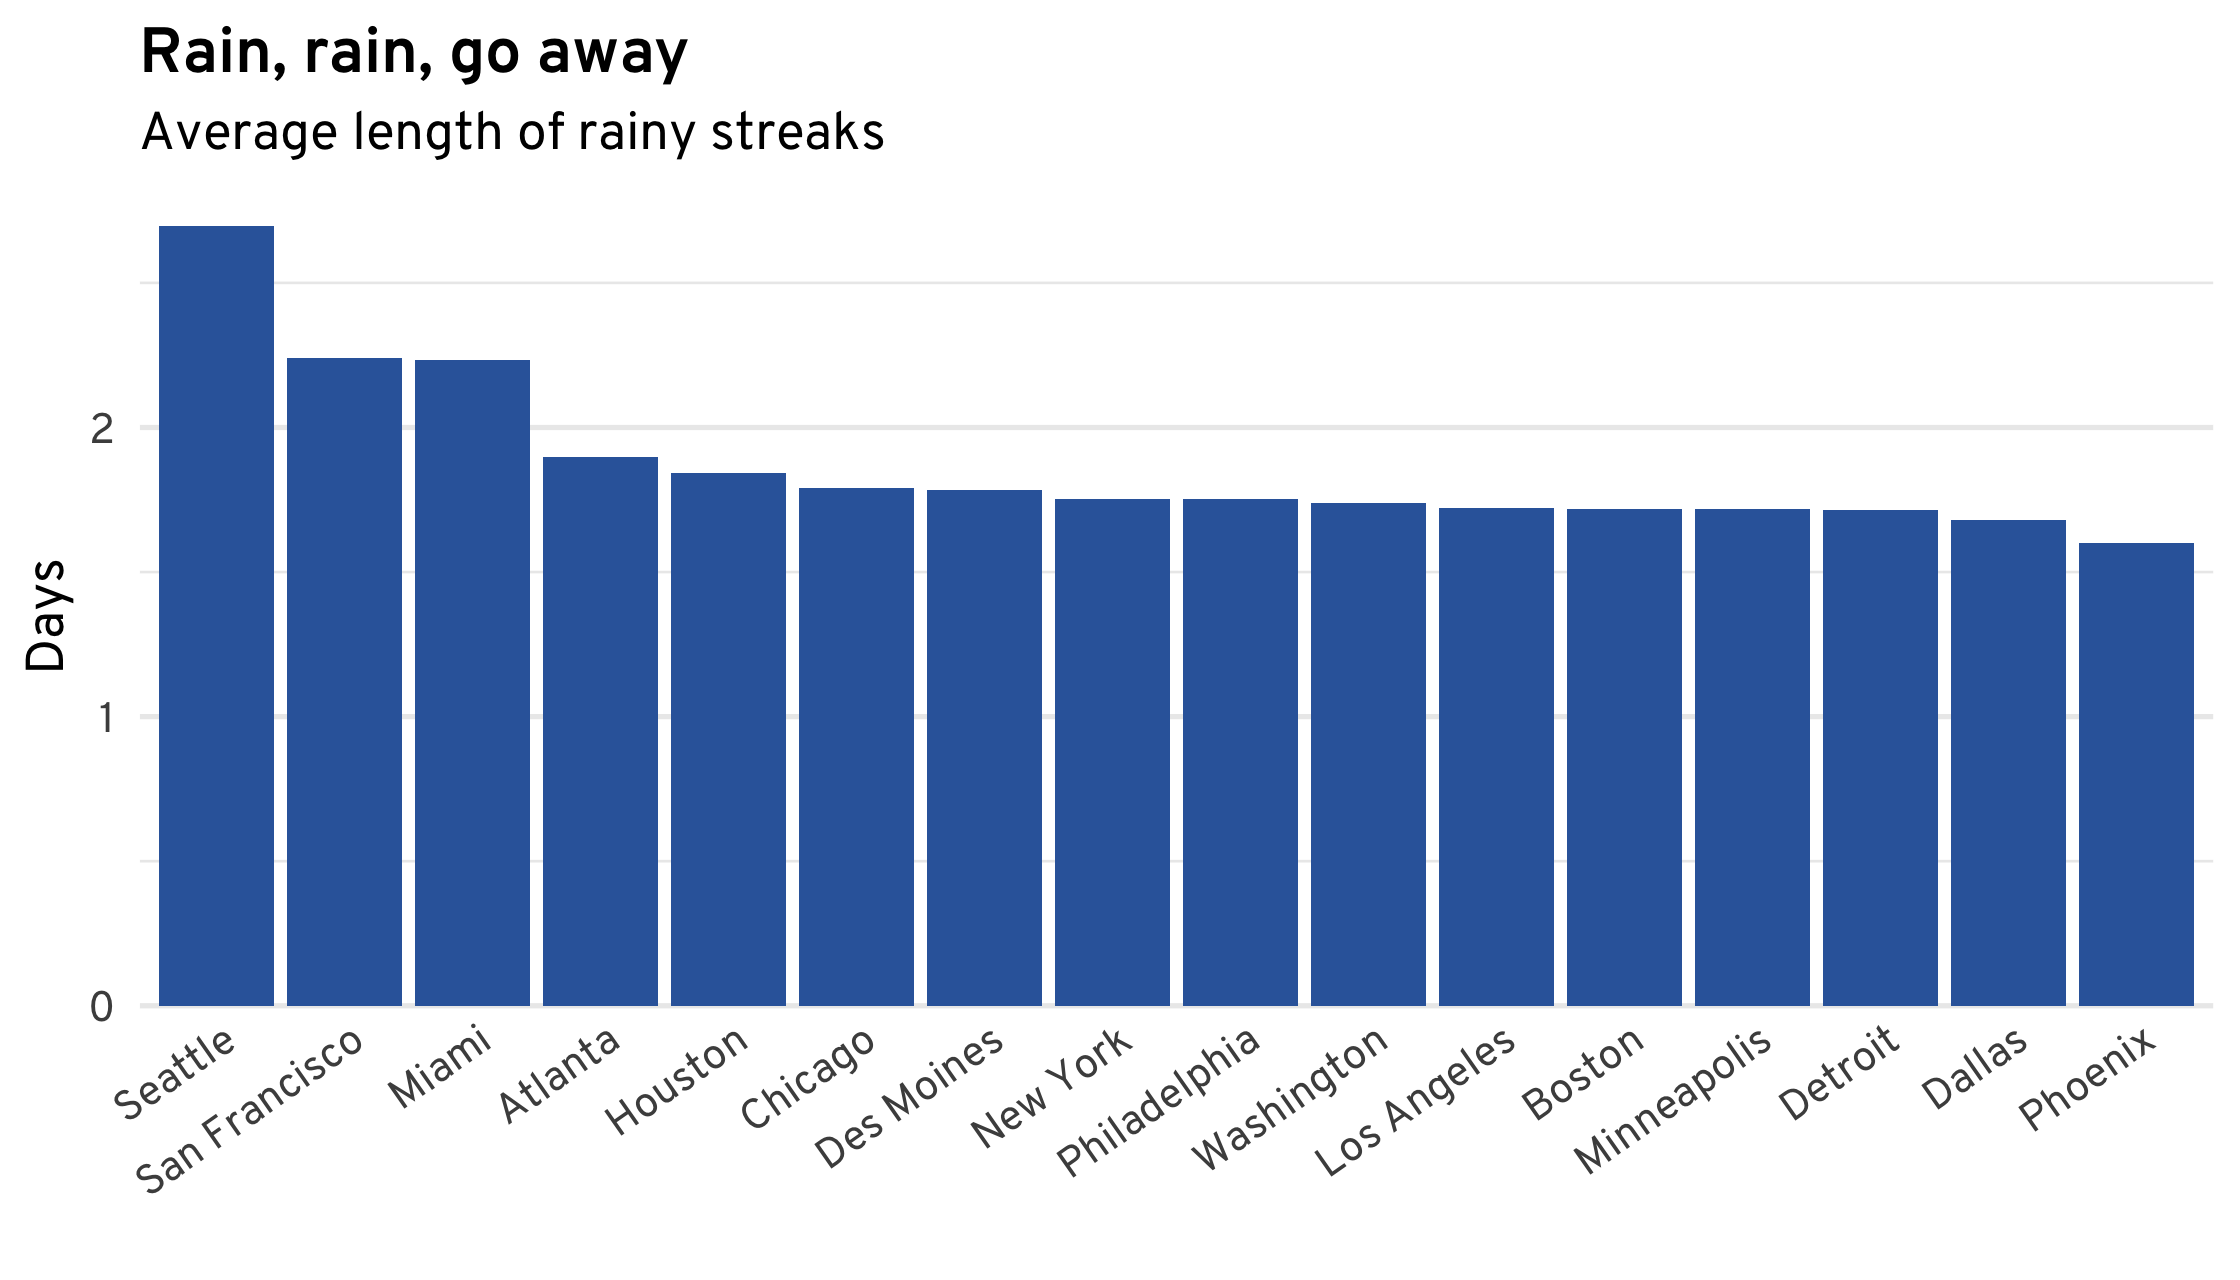
The patterns for rain are even less surprising: except for Seattle, San Francisco, and Miami, it rains for around 1.7 days at a time in most cities. Phoenix has the shortest average rainy streak, at just over 1.5 days.
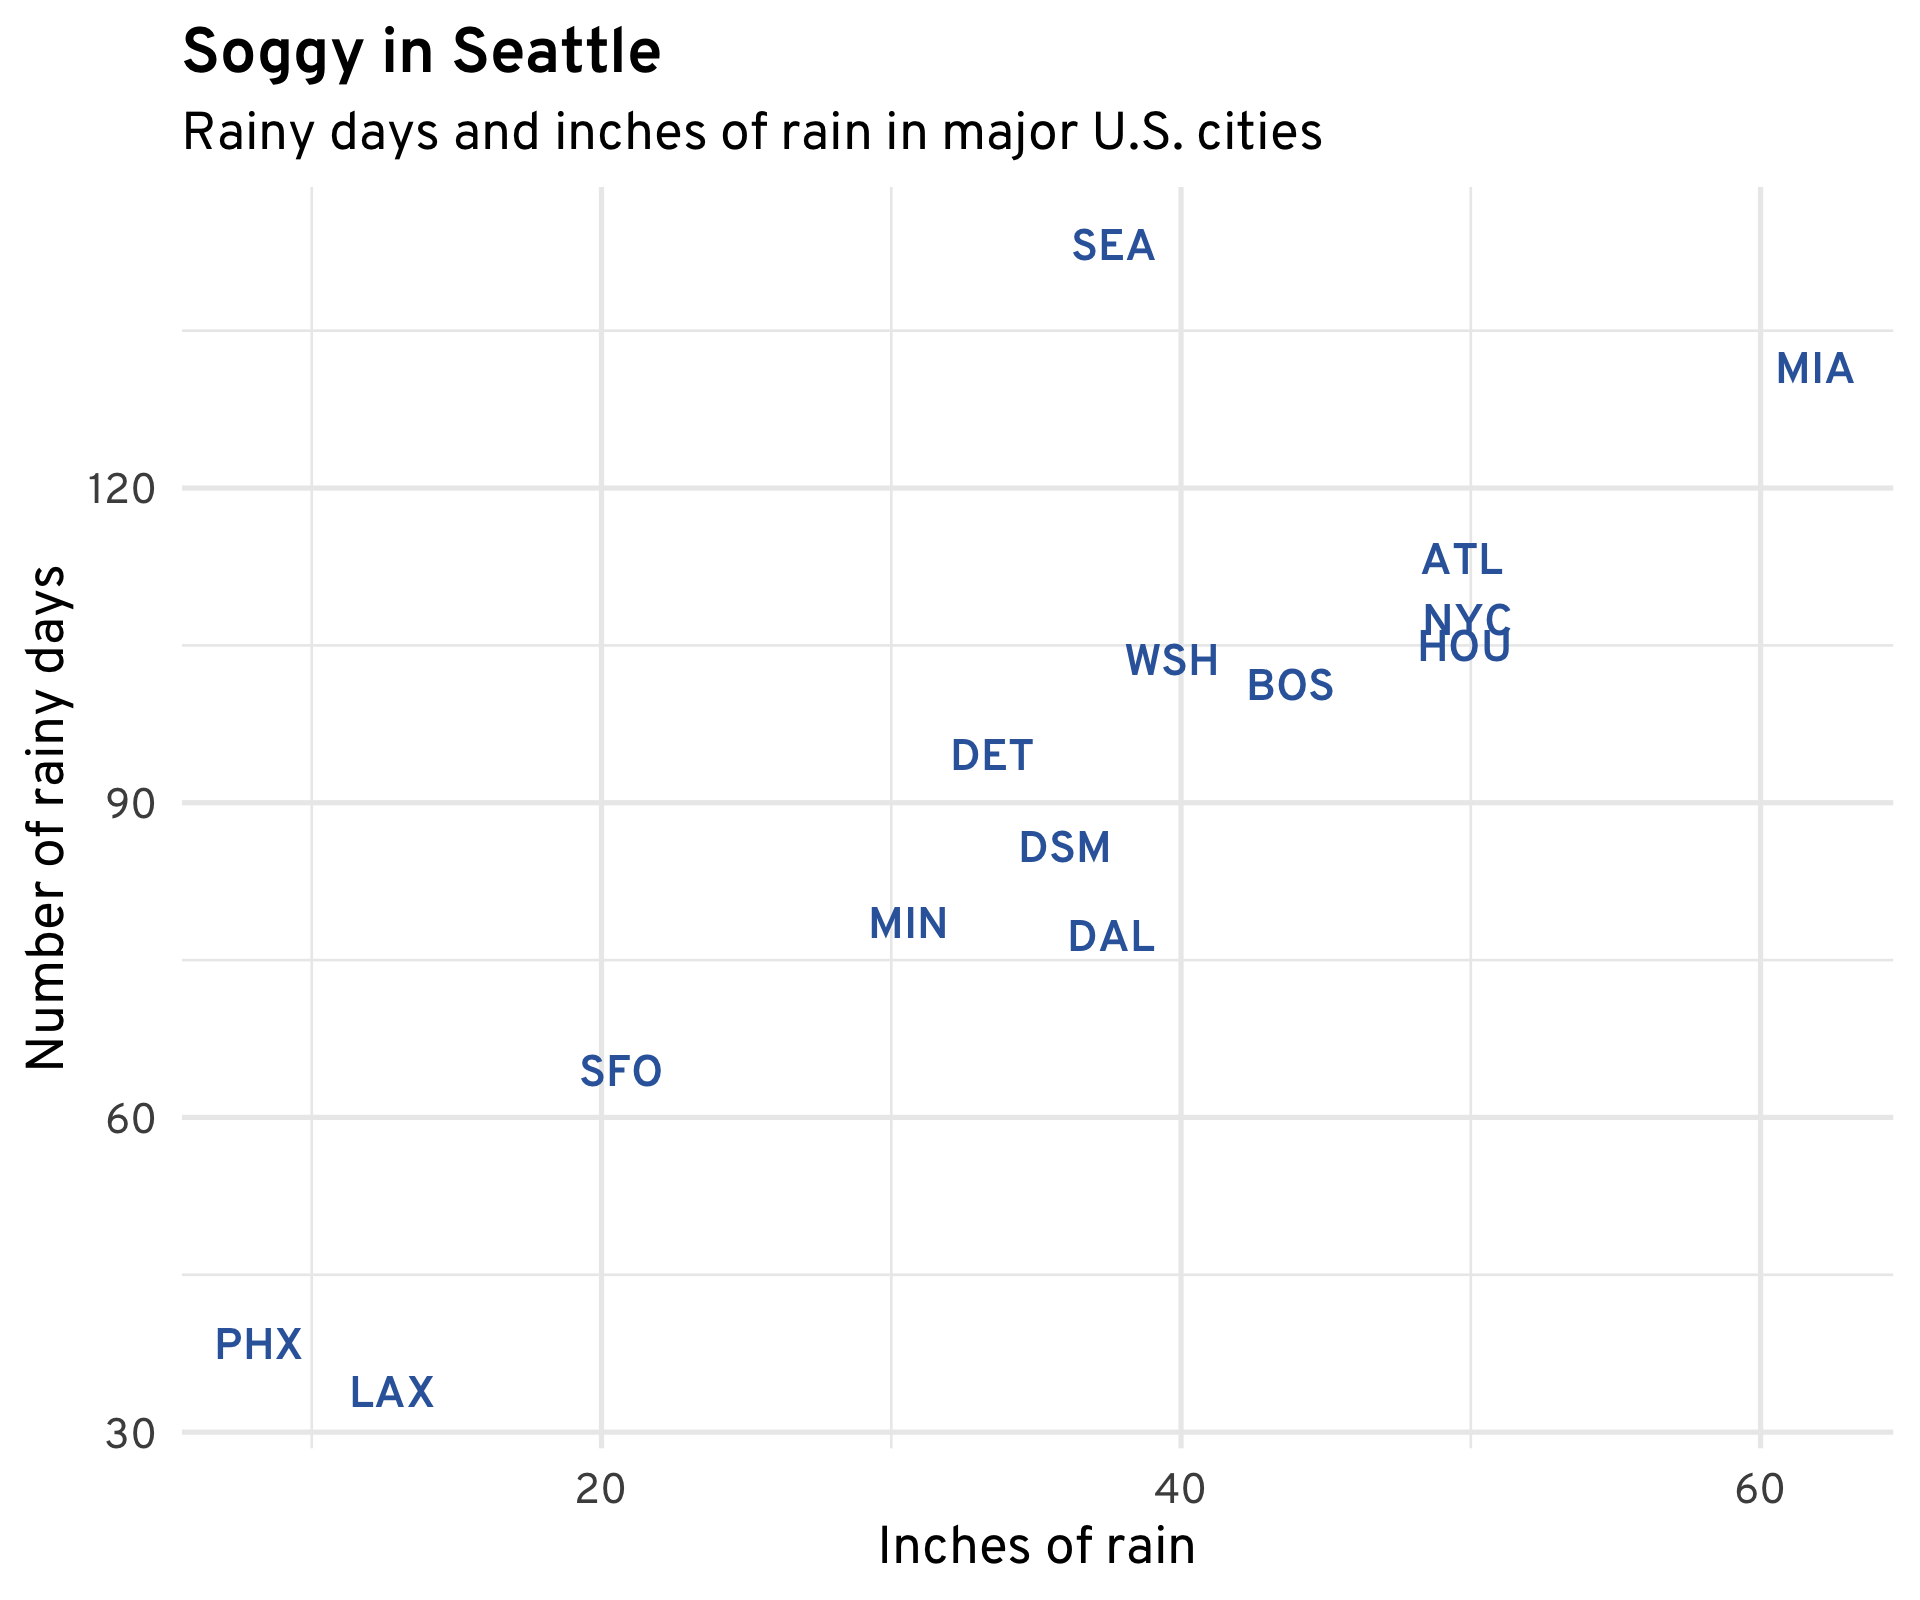
And on the subject of rain, it’s informative to look at how the amount of rain a city gets corresponds to the number of rainy days it gets. While for most cities these go hand in hand, in Seattle, rainfall is spread out over a much larger number of days. While the city receives less rain than D.C., New York, and Houston, it has more rainy days—over 140, on average—than any other major city in the U.S. Does this fairly qualify it for the title of “Rainiest City”? You decide.
Methodology
Fitting the Markov chains
Given the weather on a day, the Markovianness of the process means that the weather on the next day is drawn from a categorical distribution, with probabilities given by the corresponding column in the transition matrix. The Markov chains used here are time-inhomogeneous: the transition matrix changes from day to day. The transition matrix probabilities were assumed to vary in time along Gaussian radial-basis splines (taking into account the modular nature of dates around year boundaries), with six knots spaced evenly throughout the year.
The transition probabilities at each knot were given a Dirichlet(1) prior; this, combined with the categorical likelihood, allowed for a slight computational shortcut. Each year was broken up into 53 weeks (with the last week shorter than 7 days), and the number of transitions from each kind of weather to the other, across all the years of data, was counted. Then these counts were modelled from a multinomial distribution, with transition probabilities coming from the above splines.
Once the model was fit to each city’s data (using Stan), a transition matrix could be drawn for every week (or day, if desired) of the year, and this transition matrix could be solved for its steady-state distribution using its eigendecomposition. This yielded the weather mixture charts.
The diagonal of the estimated transition matrices represent the probability of staying in the same weather state from one day to the next. Averaging these probabilities across the four weather types (a weighted average, with weights proportional to the steady-state probabilities) yielded a composite probability of maintaining the current weather. Markovianness then implies that the number of days at a certain state follows a geometric distribution; the average streak length is then easily calculated as the reciprocal of the probability of a change in the weather.
Data
Weather data came from NOAA’s database. A day was classified as cloudy if the sun shone for less than 30% of the day. Most cities’ weather stations had around 35 years where precipitation, snowfall, and cloud cover were measured every day.