The race for president continues in these strange times, albeit with one candidate stuck in his basement. As the pandemic unfolded around us, the focus of the race shifted from the primaries to the general election, and while it’s a long way to November, Joe Biden has emerged as the polling leader and a moderate favorite to win the election, according to this site’s forecast.
There’s been some discussion of Biden’s fundraising gap with Donald Trump, and what it might mean for his prospects. But money means little unless it is put to good use, and so it is worth examining how the candidates spend their fundraising hauls.
One of the biggest uses of campaign funds, obviously, is advertising; digital advertising in particular has become central to campaigns’ strategy, in no small part because digital ads can be targeted to voters in certain demographics or states.
Following the advertising and targeting disaster that was the 2016 election, Facebook and other digital publishers have published much more data about the ads running on their platforms—the ad content, who buys them (and for how much), and who sees them, across regions and demographics.
So what is the state of digital campaign advertising in early May? Last week, Biden outspent Trump on Facebook by more than a 2-to-1 margin, paying nearly $250,000 to put ads in front of 13.1 million viewers.

Now, one might expect (as I did) that Biden and Trump would be concentrating their ad purchases in states that are likely to swing the election. Since California and Wyoming are virtually guaranteed to go to Biden and Trump, respectively, there’s little value in changing voters’ minds in these states.
We can quantify this intuition by comparing ad spending by state (on a per-capita basis) to the relative power of voters in that state—how likely an individual voter is to decide the election, compared to the average voter nationally. Voters in small swing states have the most relative power, while voters in places like California and New York have essentially zero relative power. We use per-capita figures to avoid these patterns getting swamped by differences in population; after all, we’d expect candidates to spend more in big states—there are more voters there to convince!

But as the chart above shows, there’s zero correlation between voters’ power and how much the campaigns are spending per state. The cluster of states at the left of the graph, whose electoral outcomes are all-but-determined, still saw as many or more digital ads than the more competitive states at the right of the graph.
In contrast, there’s a strong association between ad spending by state and the expected vote share in that state—Biden is spending most heavily in Democratic strongholds like D.C., California, and Massachusetts, while Trump’s biggest spending is in deep red states like Wyoming and West Virginia.

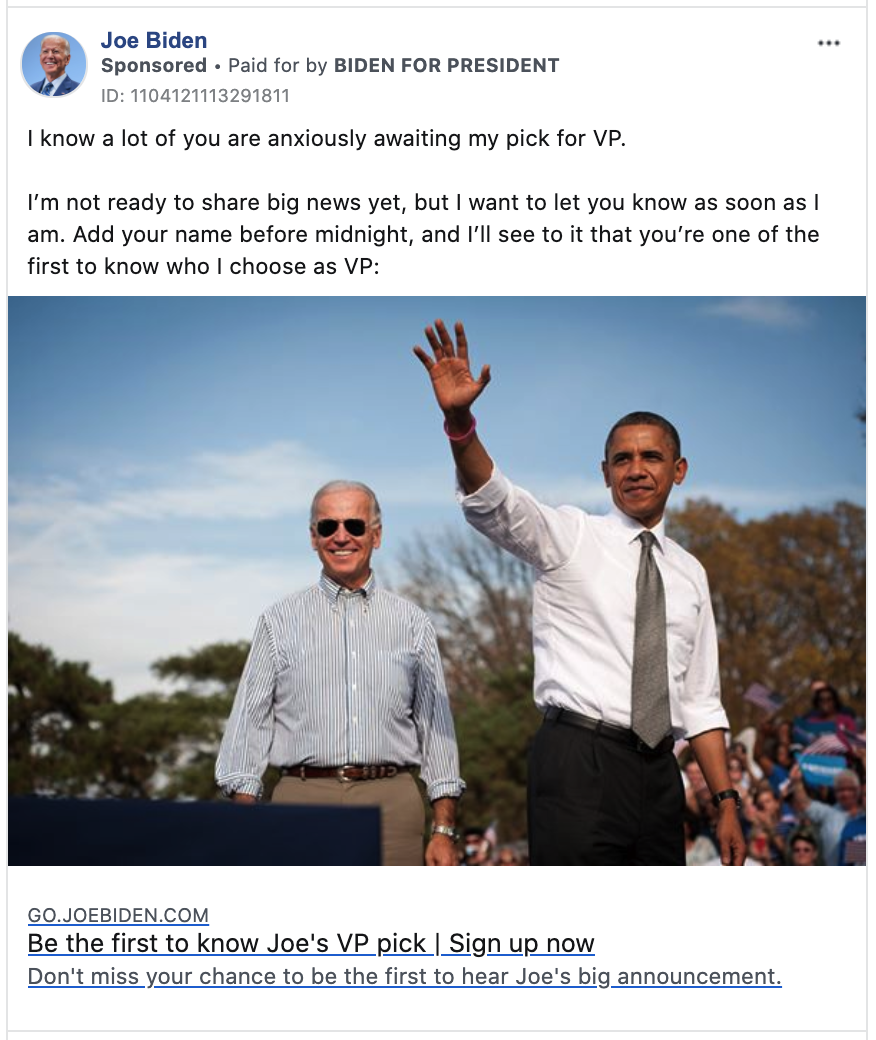
What’s going on? A look at the actual ads the campaigns are running clears things up. The images below show the active ads for each campaign that have been shown to the most voters; both are clearly designed to mobilize their bases or fundraise.
So it seems the campaigns have decided to build their war chests in the short term and worry about persuading voters later. I plan on adding ad data to the presidential forecast so that it’s easy to track how the campaigns’ strategies align with the dynamics of the electoral college.