It’s hard to watch the steadiness of Donald Trump’s job approval numbers—43% of voters approving and 52% disapproving, for most of the last year—and not be convinced that Americans are deeply polarized: one half watches Fox news, the other half watches MSNBC; one half hates immigrants, the other embraces them; one half thinks climate change is a hoax, the other wants to pass the Green New Deal. Neither half wants their children to marry a member of the other half.
And while that’s a bit of a caricature—no one really believes things have gotten that bad—as many studies have documented, polarization is indeed on the rise. There has been a lot of hand-wringing over this increased polarization, from pundits to governors and even presidents.
But lost in the overall narrative about rising factionalism are those who point out that most Americans don't fall neatly into two partisan camps. Survey questions like “do you approve or disapprove of President Trump’s job performance?” capture only one dimension of voters’ political views. When surveyed on a broad range of policy questions, most Americans are far less ideologically consistent.
What voters actually believe
There is perhaps no better way to understand the diversity of the American electorate than by talking to a random sample of voters about their political views. Thankfully, there’s an entire industry that specializes in this.
Every year, a team of academic researchers and polling firms come together to run the Cooperative Congressional Election Study (CCES), a national survey of over 50,000 randomly-selected adults. The CCES asks participants a long list of policy questions, as well as asking about their voting in national and state elections.
Below, you can page through a list of voters who were interviewed as part of the CCES. The personal details and policy beliefs come from actual Americans, but names have been made up (from Census and Social Security name tables).
For each policy question, there is a “support” and an “oppose” box, colored to match the parties’ position on the issue, and with a check mark in the box corresponding to the voter’s view. There is also a box which records how many voters nationwide supported the policy proposition. This box is colored according to which party’s position the majority of voters agree with. Throughout, bipartisan positions are colored in purple.
By tallying, across each issue, whether a voter takes a “liberal” or “conservative” position, we can assign each voter a score for their economic and social beliefs. The scores range from –100 (most liberal) to 100 (most conservative). The scores are imperfect, because most of the questions deal with policy issues that have been in the news the last two years, and there are more questions on some areas of policy than others. But they give a rough measure of voters’ beliefs in the two policy dimensions.
[Jump to the second half]The big picture
Looking at voters’ specific policy views reveals an electorate much less ideologically consistent than the traditional left-right political spectrum might suggest. In fact, only 47% of voters’ policy positions can be explained by their position on the ideological spectrum (based on something called principal component analysis).
That's not to say there isn’t any ideological consistency. Voters’ economic and political scores are moderately correlated. But there are a lot of people in the middle, who have views that could be considered both “liberal” and “conservative.”

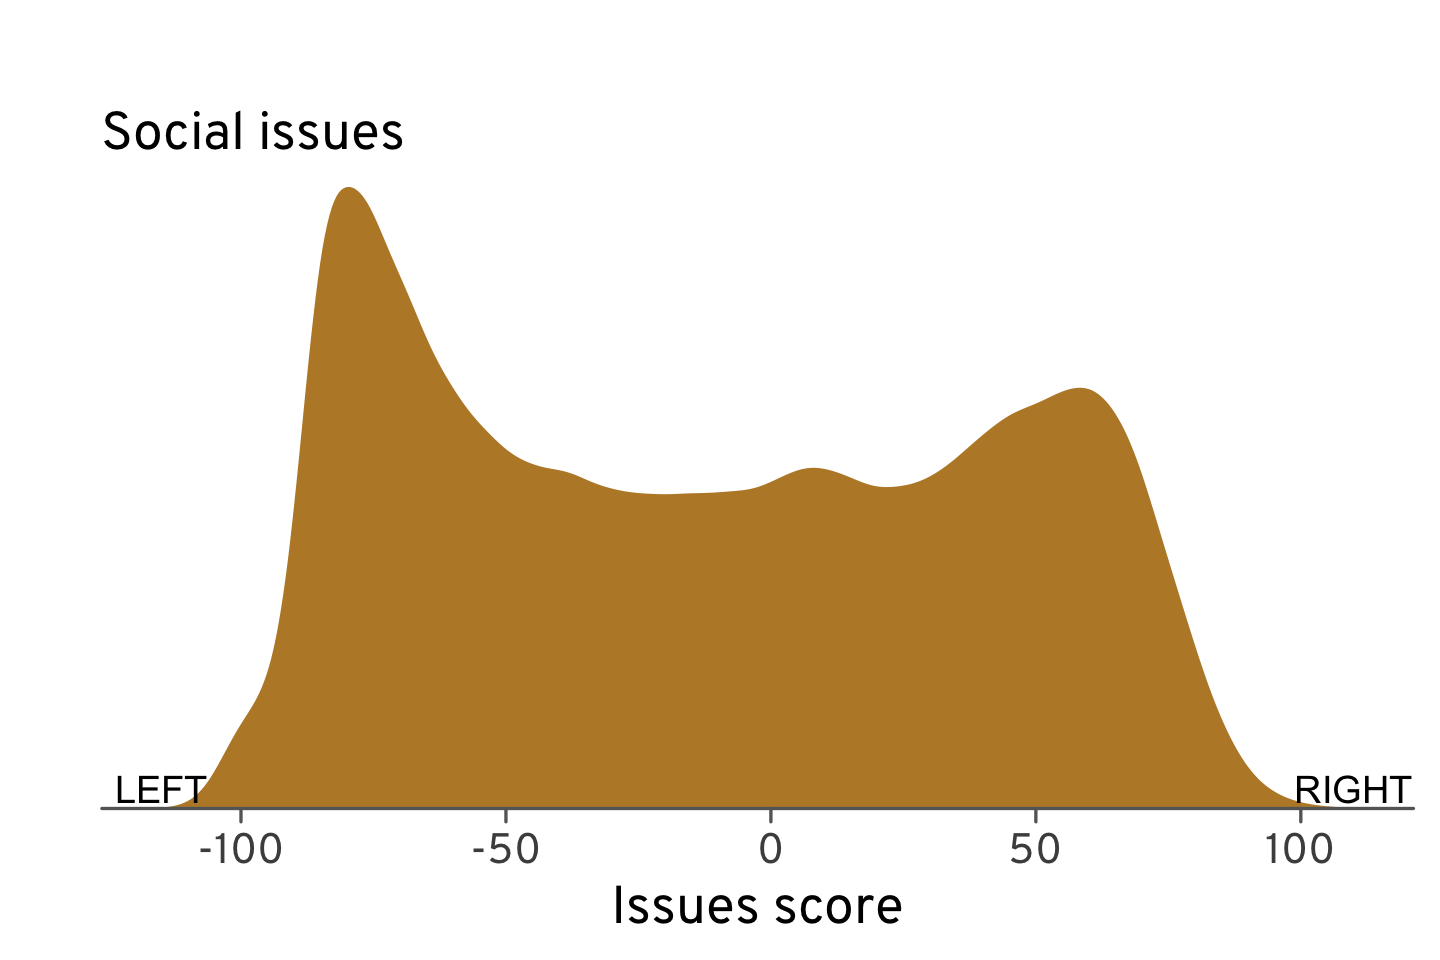
The graphs above show the distribution of voters’ economic and social scores. While there are peaks at either extreme, most voters lie somewhere between these peaks.
Voters are somewhat polarized on social issues, with two clear peaks on the spectrum. There appears to be less polarization on economic issues; as the large peak around –50 shows, when it comes to economics, there’s actually more of a center-left consensus. (It’s worth pointing out that Medicare for All was supported by nearly 7 in 10 of surveyed voters. The only Republican policy more popular was a middle-class tax cut.)
Polarization is stronger on social issues, and among the “elite”
What, then, explains the growing concern around polarization? To be sure, the graphs above reflect more polarization than there was ten or twenty years ago. But it also turns out that polarization and income go hand in hand.
Dividing voters by their household income is necessarily arbitrary. Here, we split the income scale into three pieces: $, less than $40,000 a year; $$, between $40,000 and $150,000 a year; and $$$, more than $150,000 a year. Using this division, we can look at how Democrats (blue), Republicans (red), and independents (gray-green) line up on the ideological spectrum.
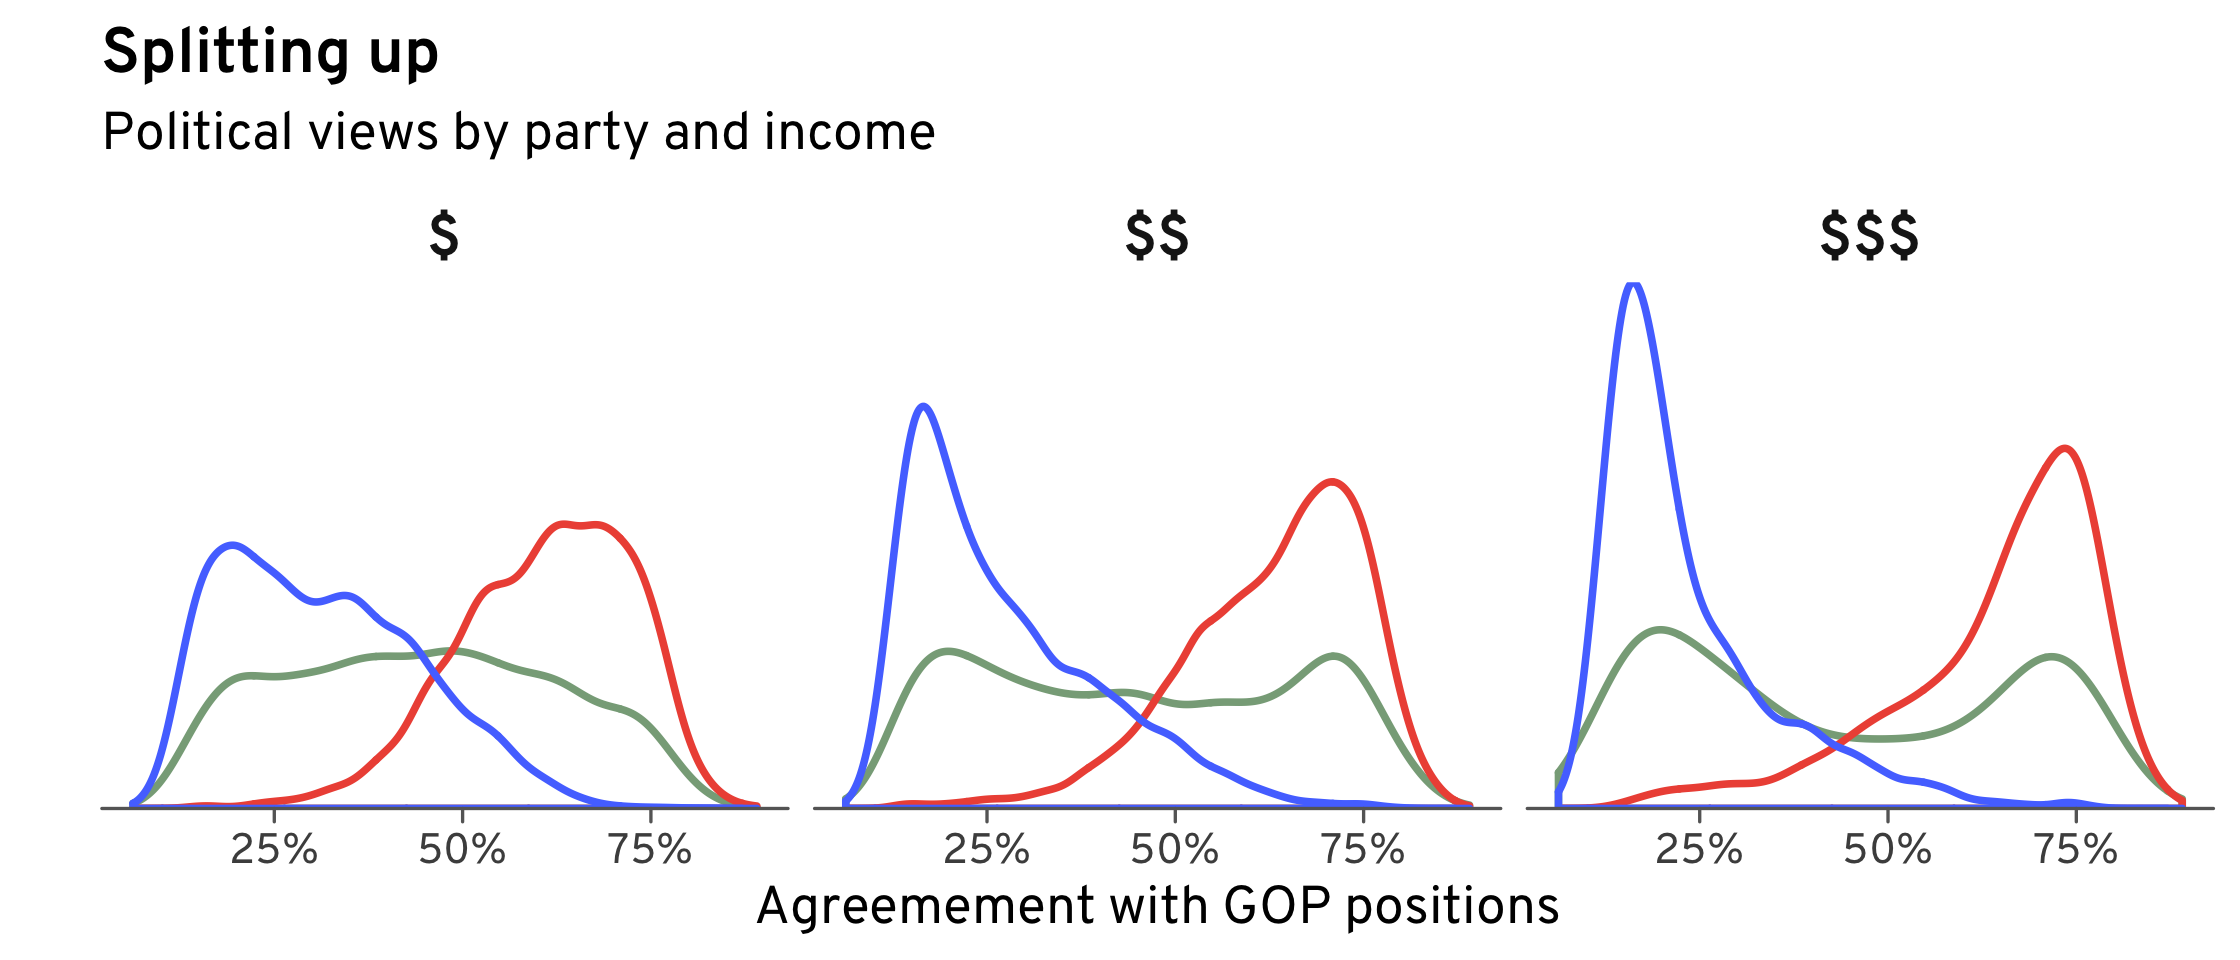
While lower-income Democrats are more liberal than lower-income Republicans, they are far less polarized. And lower-income independents show no indications of being polarized—they congregate in the middle of the spectrum. Higher-income voters, in contrast, are clearly divided into two camps, even among independents.
We can measure this polarization a bit more precisely, using the standard deviation of voters’ economic and social issue scores—essentially, how “wide” the peaks in the above graphs are. A larger standard deviation in a certain group means voters in that group are more spread out along the ideological spectrum—more polarized.
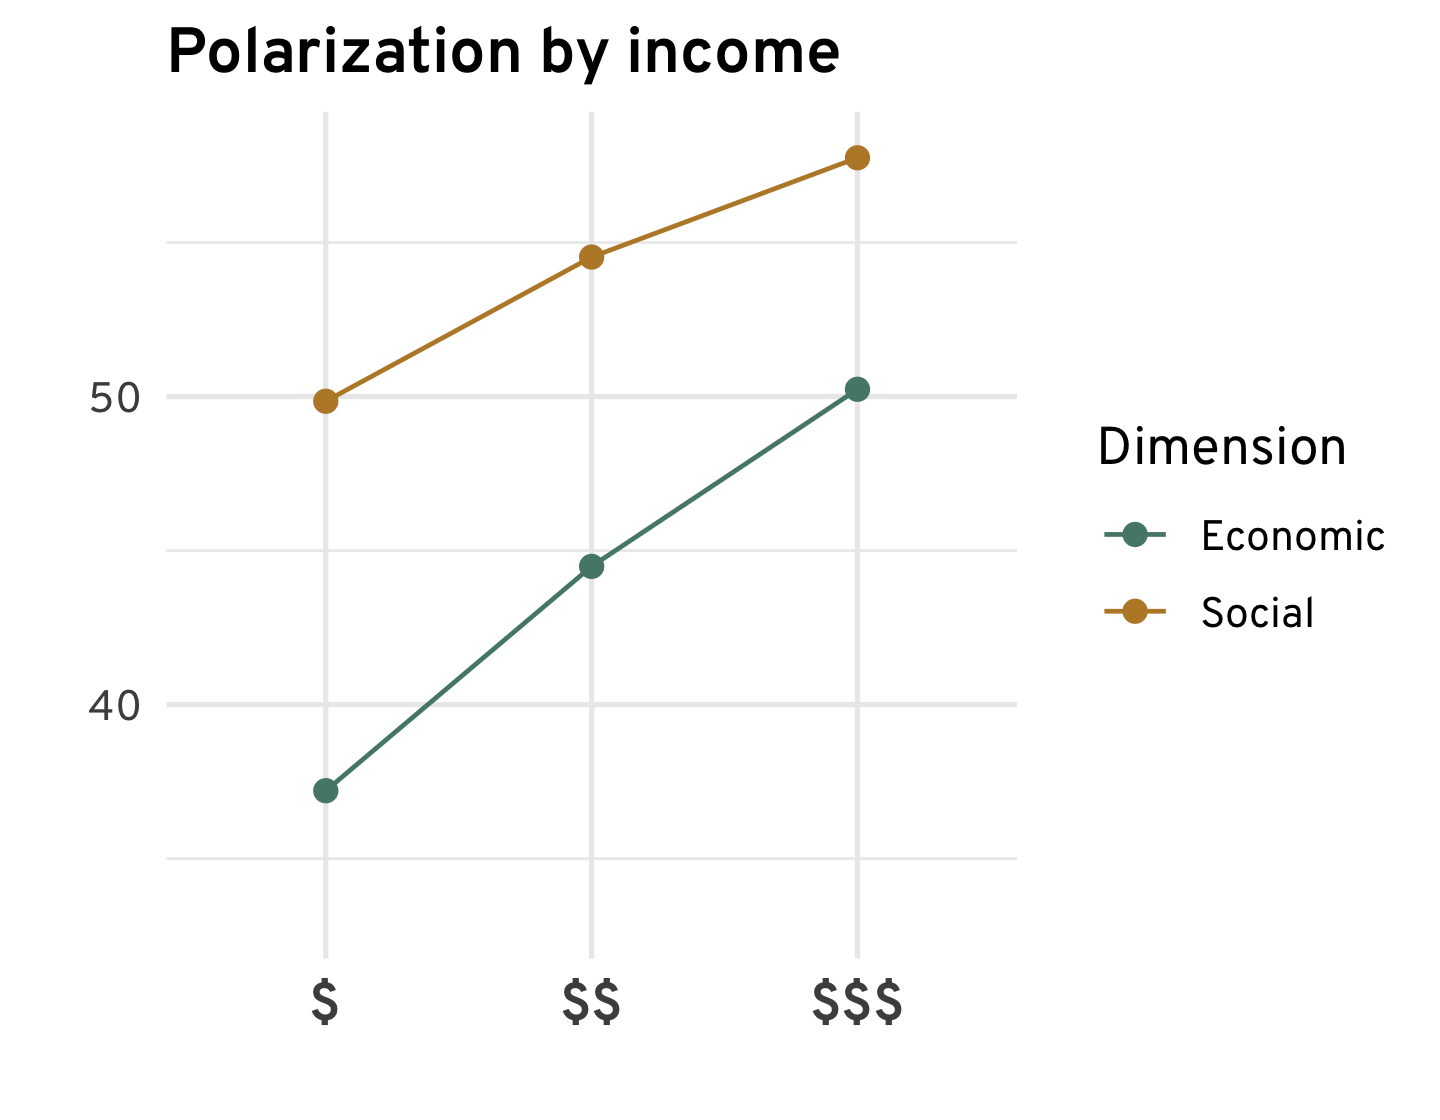
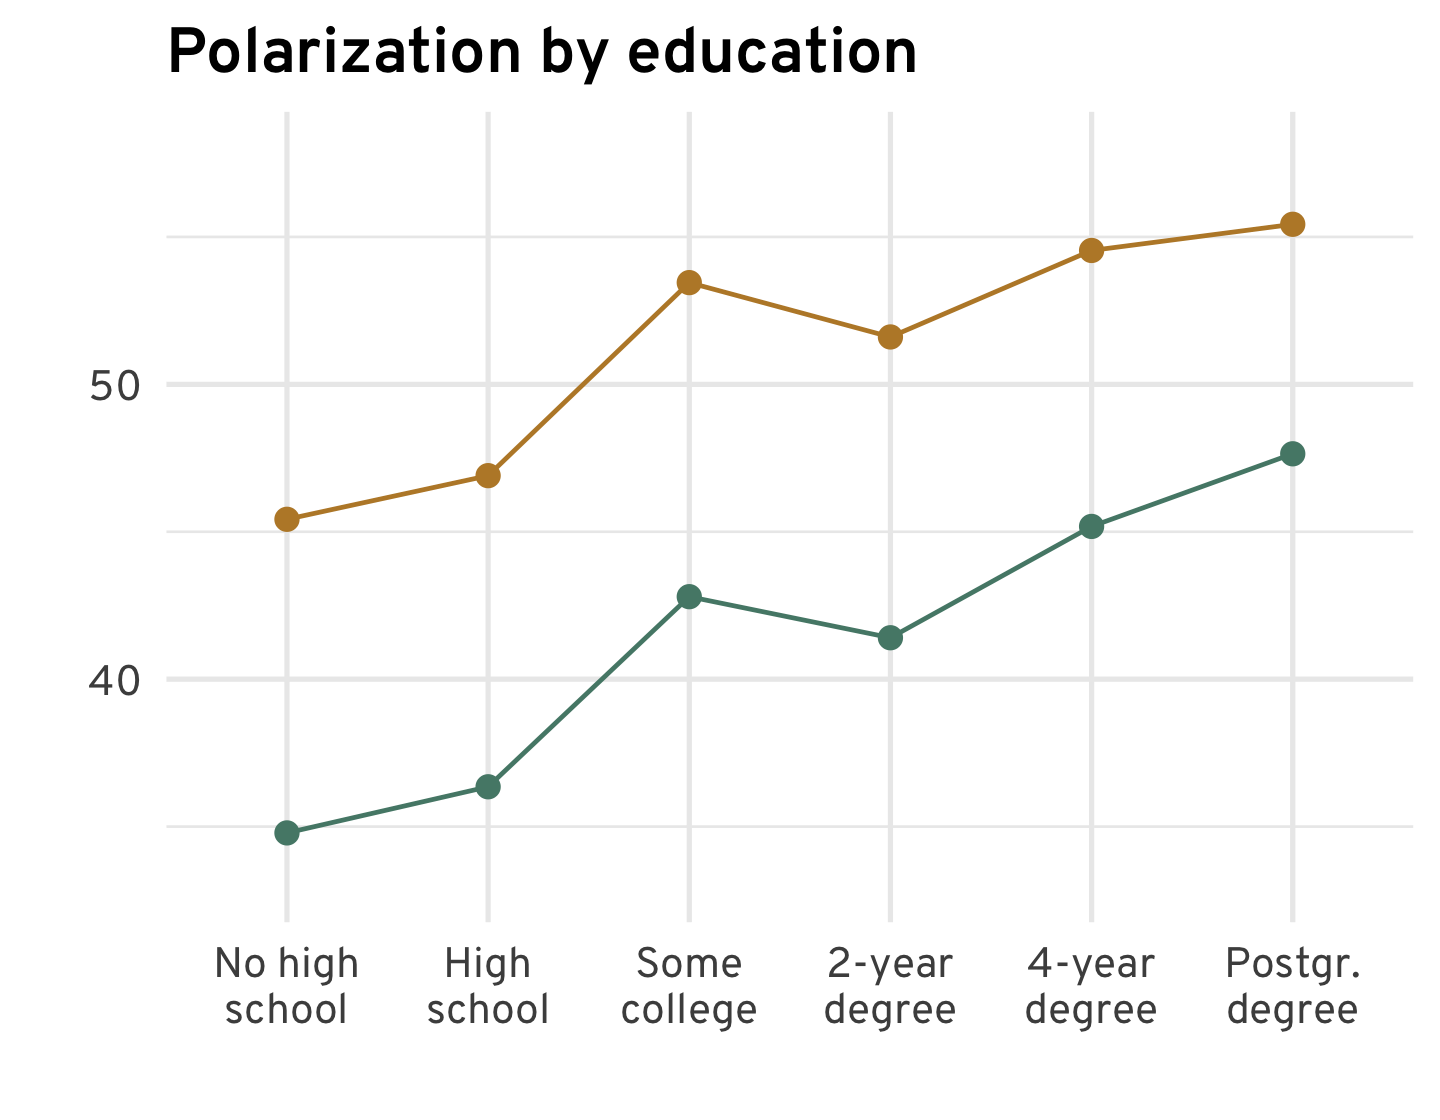
The graph above shows these standard deviations, by income and education. We see the same two patterns: wealthier and better-educated voters are more polarized, and voters are more polarized on social issues than economic issues.
Across the board, the wealthy are more conservative
Polarization is one thing, but what about the actual beliefs of the wealthy? A first glance seems to confirm the “David Brooks theory” (for lack of a better moniker) of political polarization: globalist, socially liberal coastal elites are at odds with populist, protectionist social conservatives.

The graph above shows the average social and economic scores for each income group. Indeed, lower-income voters are the most socially conservative and the most economically liberal, while higher-income voters are the most socially liberal and the most economically conservative.
But these trends are complicated by the strong link between education and income. In fact, when we break out the above graph by educational attainment, the story changes.
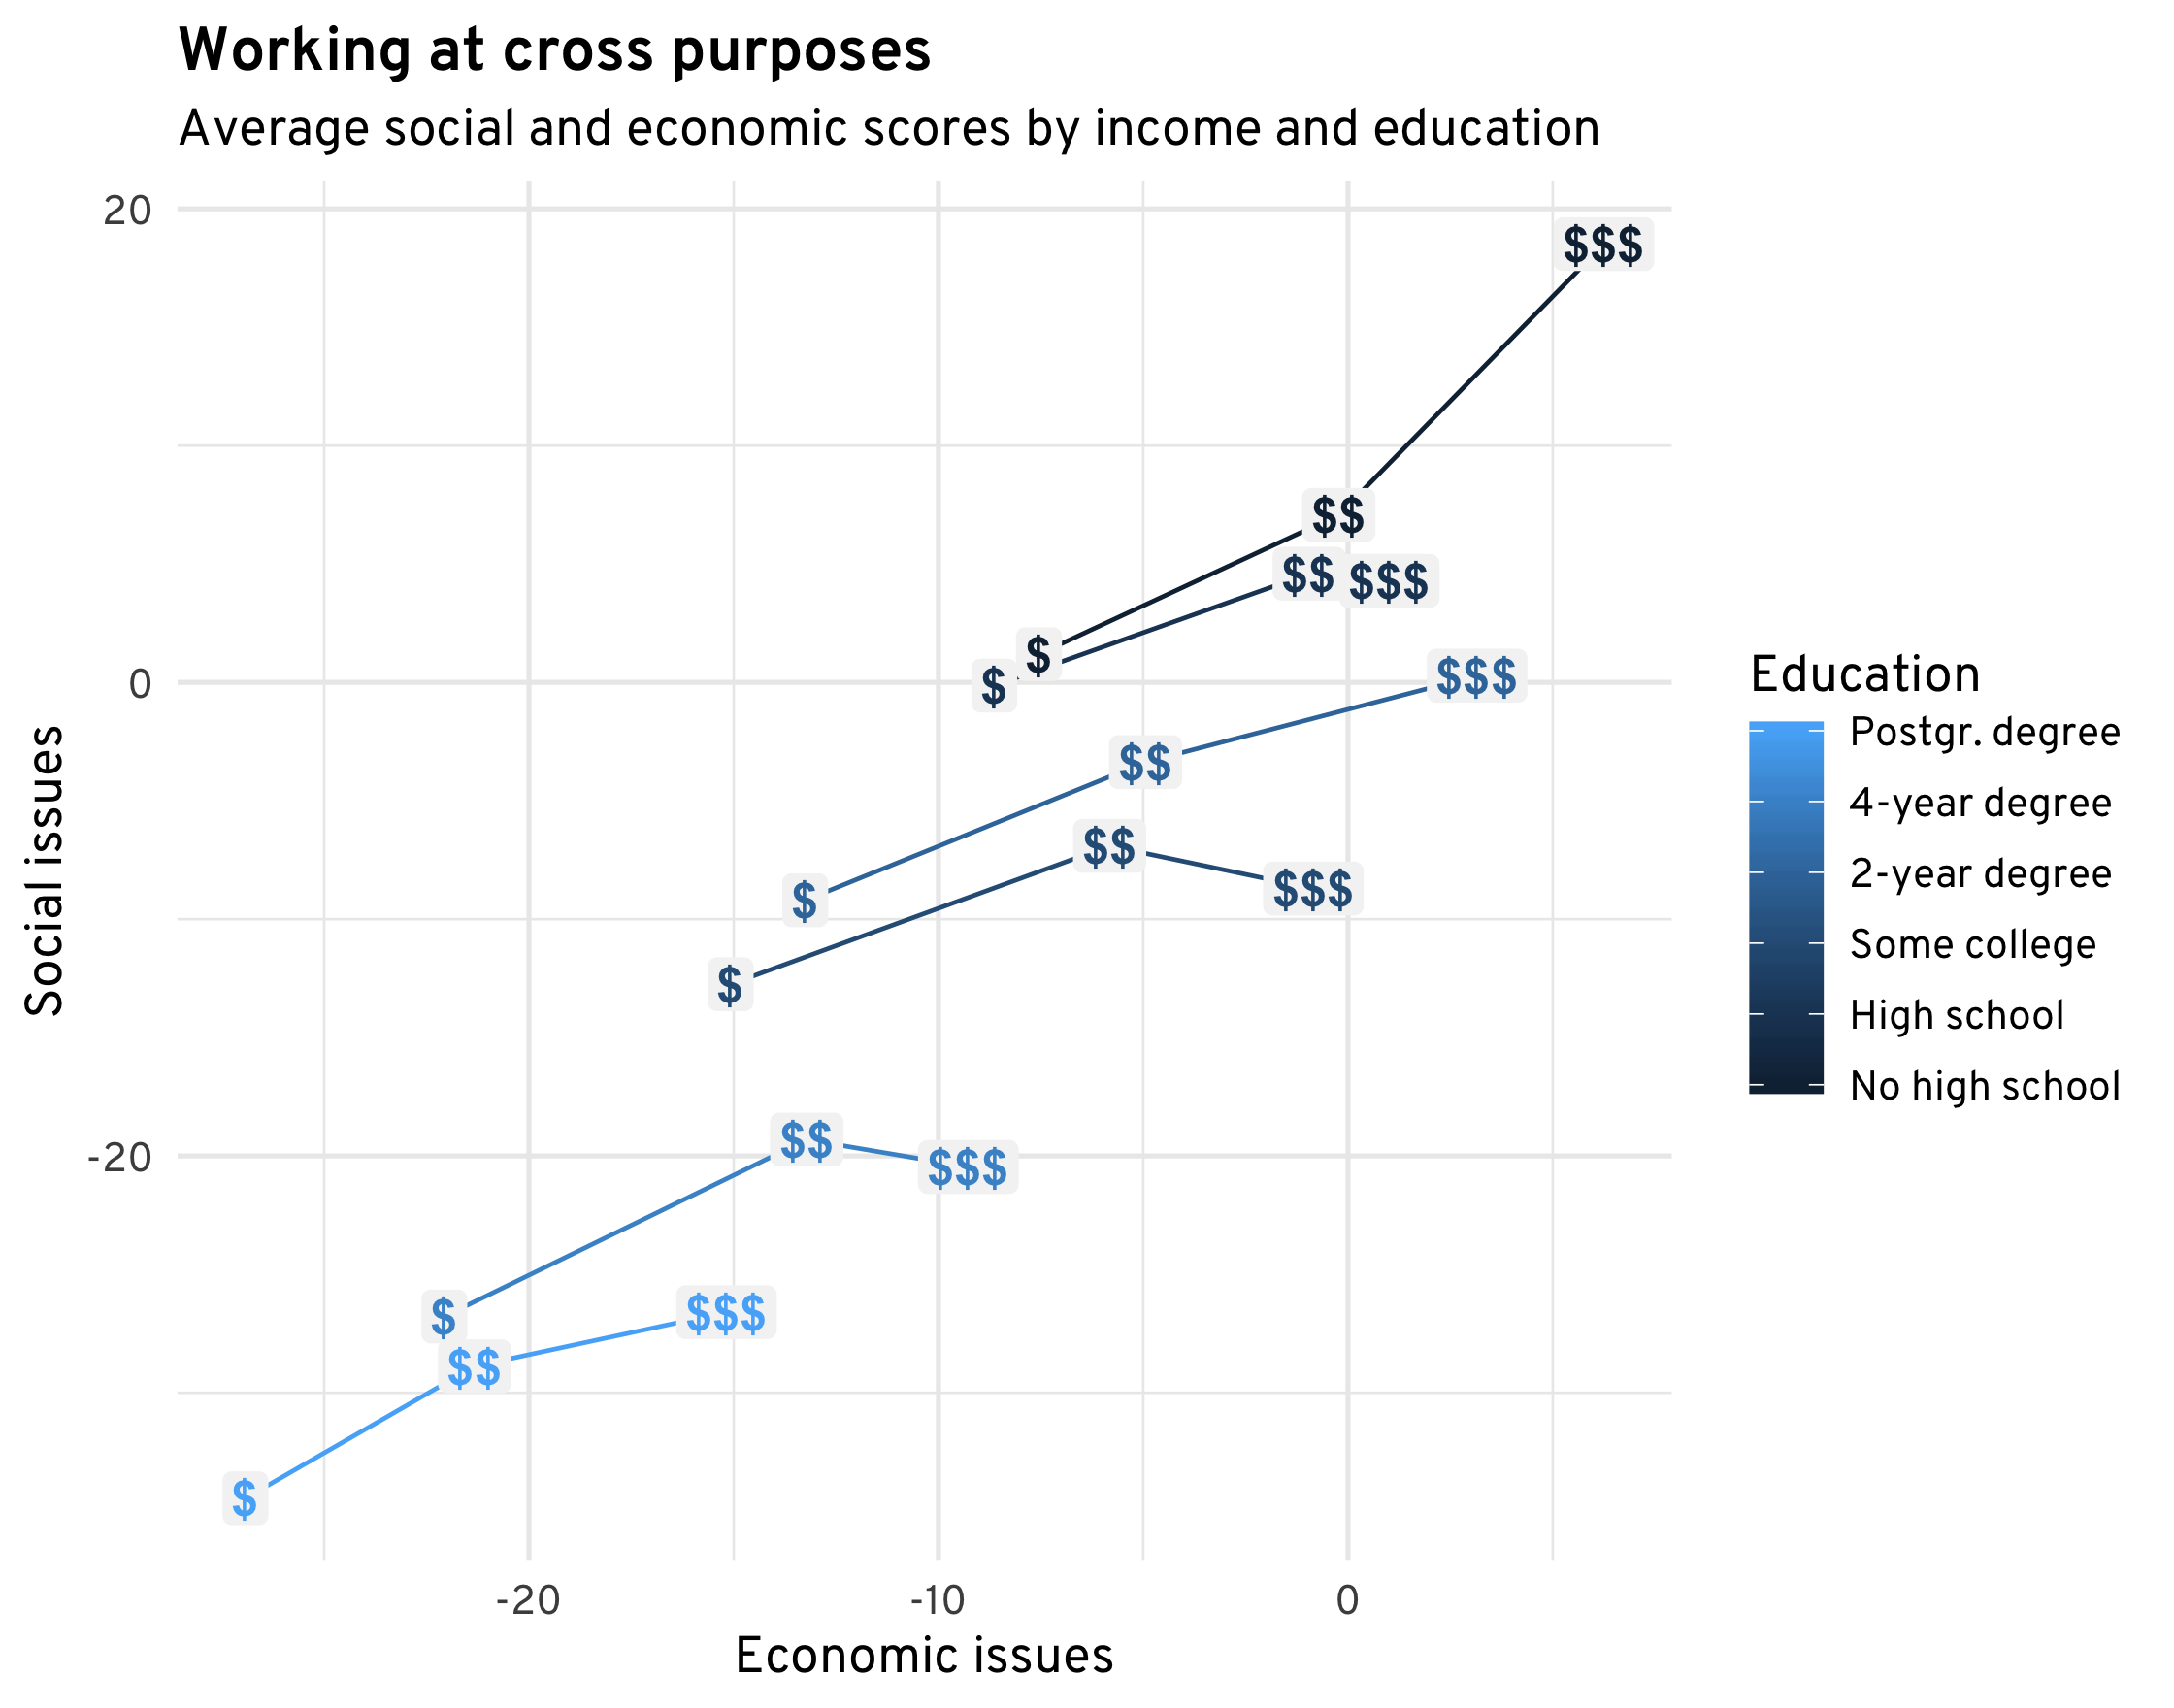
The graph above has one line for each education level. More educated voters—lighter blue lines— are more liberal socially and economically. But within each level, the line slopes upwards—wealthier voters are more conservative, socially and economically. So the most conservative group here are the wealthy without a high school diploma, while the most liberal are lower-income voters with a postgraduate degree. Higher education and higher income pull voters in opposite directions, and both must be factored in when talking about the “elite.”
Other divisions are important, too
Of course, income and education are not the only dividing lines in America today. The graph below has one line for each major racial group, which is in turn broken up by income group. While in the education/income graph there was a consistent pattern across groups, here there is not.
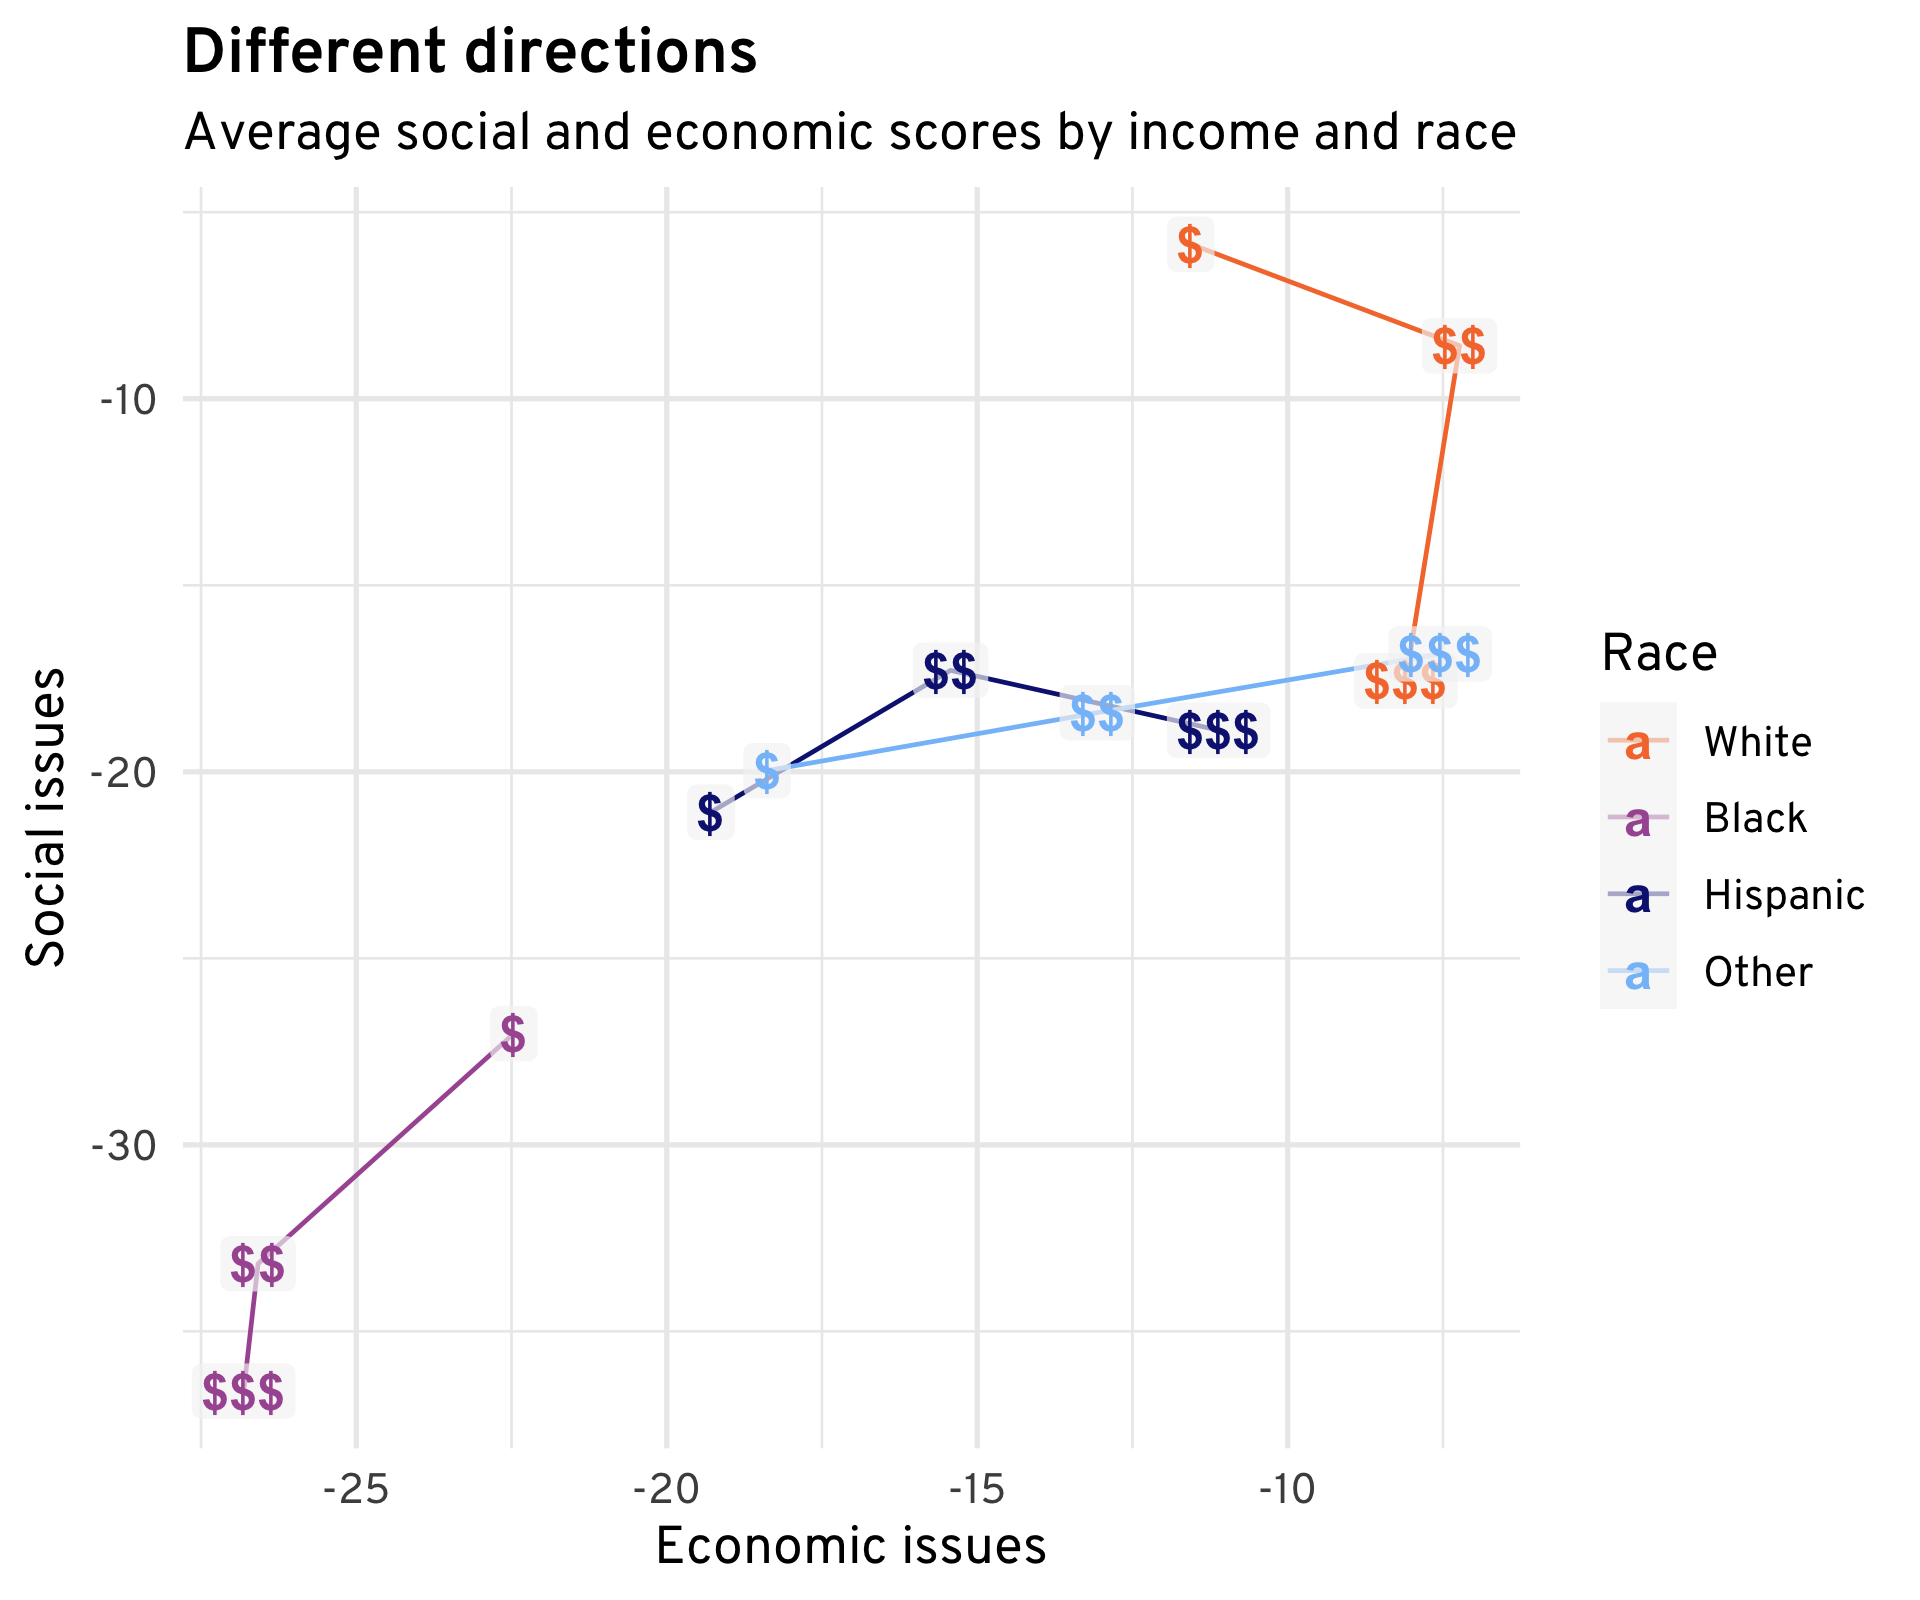
For both whites and blacks, higher-income voters are more socially liberal than middle-income voters. But for Hispanics (the category used by CCES) and all other races, higher-income voters held about the same social views as middle-income voters, but were much more economically conservative.
Other divides are equally interesting. Much has been made of the urban-rural split, which has been a current in American politics since Thomas Jefferson. Only recently however, has this split so neatly aligned with the prevailing left-right spectrum.
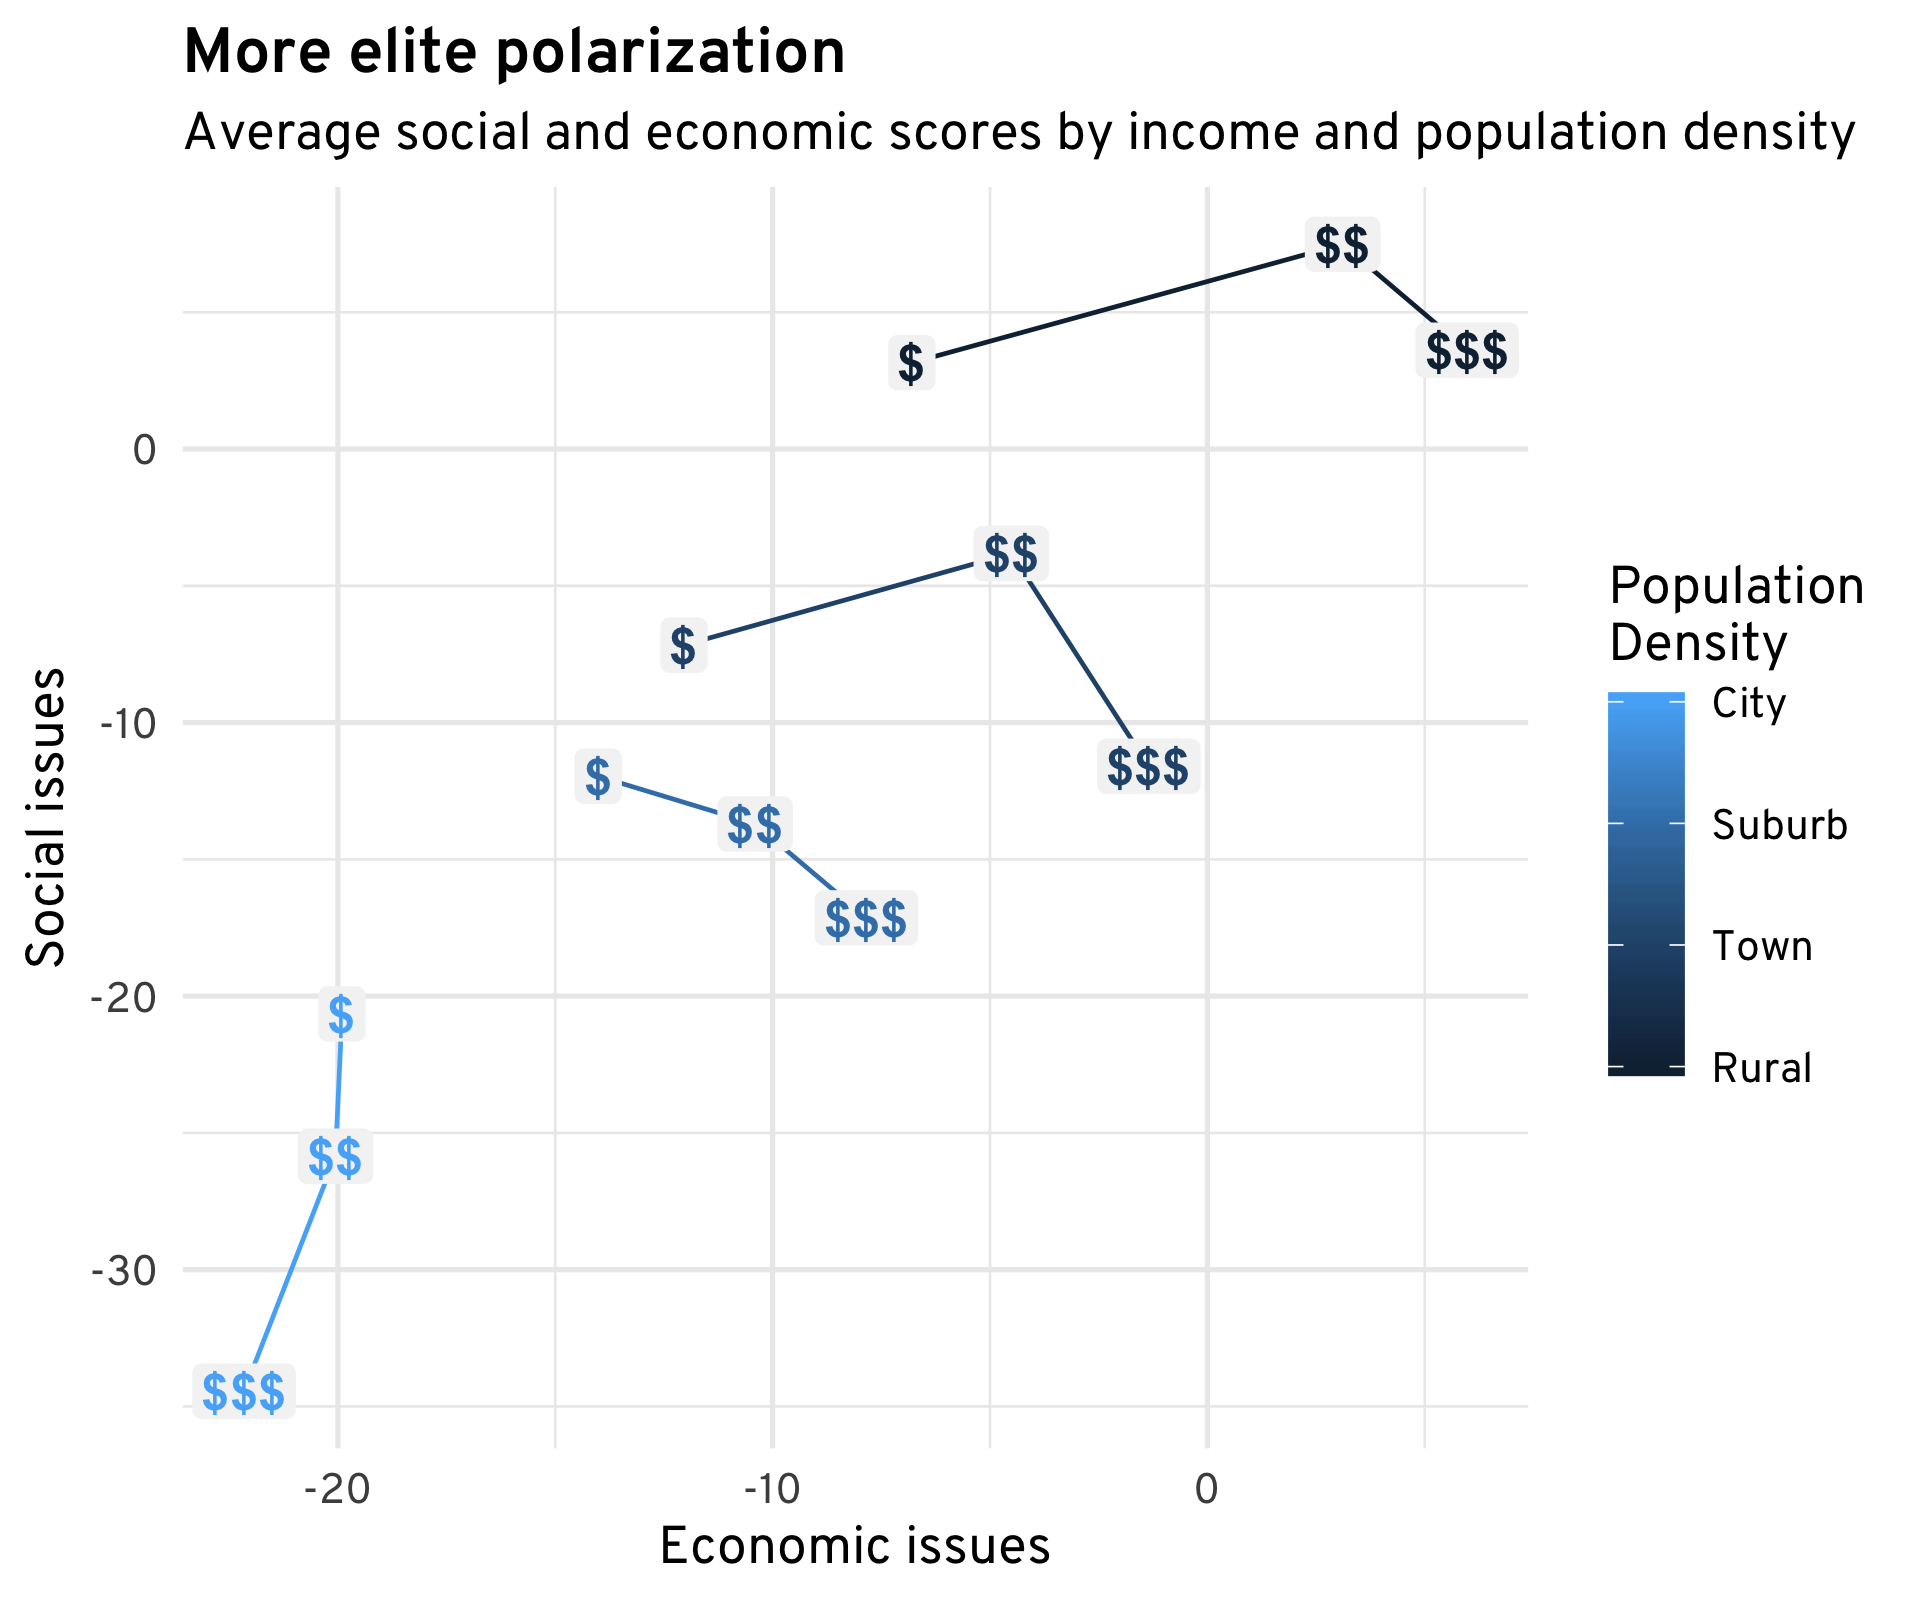
The graph above has one line for each type of place voters live, from cities to rural areas. Unsurprisingly, rural areas (dark blue) are more conservative, socially and economically, than cities (light blue). But while higher-income city dwellers hold about the same economic views as their lower-income counterparts, they are much more socially liberal. And in rural areas, higher-income voters hold about the same social views as lower-income voters, but are much more economically conservative. In other words, the income divide in cities is a social one, while in rural areas it is an economic one.
The upshot is that higher-income voters are more polarized than lower-income voters. On the graph, the upper-income group is spread out along the diagonal, while the lower-income group is more concentrated in the upper left: more economically liberal, but more socially conservative.
Conclusion
None of this is to downplay the seriousness of growing partisanship in Congress and polarization in the electorate. But when it comes to American’s political views, few things are straightforward. Many voters have ideologically mixed positions. And demographic divisions can interact in complicated ways, leading to surprising patterns.
While simple narratives can be compelling and easily understandable, ultimately American voters are far more complicated than labels like “liberal” and “conservative” suggest.
Data from the Cooperative Congressional Election Study. Person silhouettes from ProPublica’s WeePeople.