AFL-CIO headquarters, Washington, D.C.
There is power there is power in a band of workingmen,
When they stand hand in hand,
That’s a power, that’s a power
That must rule in every land—
One Industrial Union Grand.
“Big Labor’s Big Shrink,” gloated the headline of a Wall Street Journal editorial last year, using Joe Biden’s presidential campaign kickoff at a union hall as an opportunity to trot out its tried-and-true union-bashing lines.
“Big Labor” suggests a force to be reckoned with, a monolithic entity—one with ambition, strategy, and means. “Big Labor” and “Big Government” are supposed to go hand in hand. The AFL-CIO headquarters, after all, sits just across Lafayette Square from the White House.
But just as the forces of American capital are not controlled by the Chamber of Commerce—which is also located across from the White House—labor’s power isn’t managed out of D.C., doled out by union bosses as part of a Big Plan to destroy productivity and end freedom as we know it. American labor is a patchwork—a tangled web of national and local unions, federations, councils, joint boards, and nonprofits.
That’s not to say that labor’s power isn’t concentrated in certain regions, sectors, or unions. But to ignore the diversity of labor’s constituent parts is to fail to grasp the complexity of the labor movement, and the challenges it faces. Despite recent optimism and a wave of public sector strikes, labor’s power is still waning, especially in the private sector. And despite the mergers of several national unions over the past few decades, unions in the United States remain more fragmented than their peers abroad. Understanding this fragmented landscape is critical to building a winning strategy for American labor in the next decade.
To that end, we’ll look at the overall size and structure of American unions, their spending patterns, and their internal structure and staffing.
Labor is big, but not that big
In 2018, there were 156 million people employed in the United States: 20 million in the public sector, and 136 million in the private sector. Among those who work for salaries or wages, just over 10 percent were union members—a total of 14.7 million union workers. These workers are split roughly evenly between the public and private sectors, meaning that almost 94 percent of private-sector workers are not represented by a union.
| Private sector | |
|---|---|
| U n i o n |
Non-union |
| Union | Non-union |
| Public sector | |
|---|---|
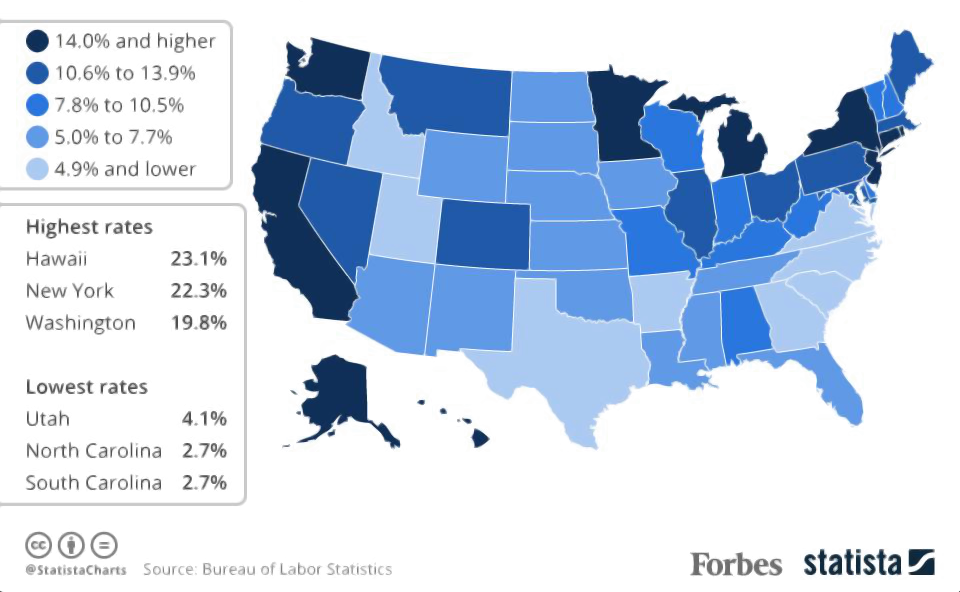
Union membership rates vary drastically by state, as the map below shows. Unsurprisingly, union density is strongly correlated with the absence of so-called “right-to-work” anti-union laws, though there are exceptions (like Michigan and Nevada, which are both “right-to-work”).
The 7.6 million unionized private-sector workers are represented by 15,047 different local unions—most affiliated with one of 132 “international” unions, but many others belonging to independent or unaffiliated unions.
Each circle below represents an international union, sized in proportion to the union’s overall membership (in all sectors). Unions in blue are affiliated with the AFL-CIO, the umbrella organization for the labor movement. Unions in green are affiliated with the Change to Win Federation (CTW), which broke away from the AFL-CIO in 2005 (some of the unions which broke away have since reaffiliated). Unions in yellow are independent. You can hover over each union to learn more, and click to highlight one.
The NEA and the AFT, both teachers' unions, collectively represent over 4.5 million workers. Other large unions include AFSCME, which represents state and local government employees, UFCW, SEIU, and the Teamsters (IBT), which each represent workers in a diverse array of industries.
But even these large unions together represent barely half of all unionized workers. Millions more belong to industry-specific small international unions, like the 22,000-strong United Union of Roofers, Waterproofers and Allied Workers (RWAW).
So in one sense, unions are “big” enough to go up against the largest employers in the country. But while a union like the NEA may have the most members, that doesn't necessarily translate to financial resources, which are often a more important factor. When we size each union by its net assets, a different set of "big" unions emerges.
The UAW is the wealthiest international union, with $1 billion in net assets, mostly consisting of its large strike fund. Other wealthy unions, like the USW, CJA, and IBEW, consist mainly of workers in declining industries (like steel) or industries that have become less unionized (like construction). Despite this, larger unions have generally done better than small unions in the last decade, tending to maintain rather than lose their membership.
For comparison, here's Walmart, the largest private employer in the U.S., with $79.6 billion in net assets.
That's around ten times the net assets of all the international unions combined. In a single company.
With corporations operating on this kind of scale, it's no surprise that the UFCW (net assets of $336 million) has struggled to unionize Walmart's retail employees.
Some unions are spenders, others are savers
Beyond the size of their membership, another important way that unions differ is in the scale of their financial resources relative to their membership, and how they choose to spend these resources.
Below, unions are arranged from left to right in order of their per-member net assets. This is a good measure of unions’ wealth, as it accounts for the size of the membership—all else being equal, we would expect larger unions to be able to collect more dues, and therefore to have more net assets. Dividing by the number of members controls for this effect.
The wealthiest union on a per-member basis is the American Train Dispatchers Association, a small craft union. The UAW, the union with the most total net assets, still is near the top on a per-member basis. The largest unions, like the NEA, generally have fewer net assets per member due to their extremely large size.
This split becomes even clearer when unions are ranked by how much they spend, relative to how much they're worth.
Unions like the AFT or the AFGE spent around three times their total assets in 2018, while the UAW and the CJA spent less than a quarter of their total assets.
Most union spending, after taxes and AFL-CIO dues, can be roughly broken up into four categories:
- Representational: contract negotiations, grievance handling, corporate research, litigation, and new worker organizing.
- Political: spending on political candidates (including through PACs) and lobbying.
- Benefit & grant: pensions, health and life insurance, charitable contributions, scholarship funds, and more.
- Overhead: membership meeting, conferences, supplies, rent, support staff, member education programs, and more.
Several important unions which prioritize these categories differently are highlighted below.
It's important to note that local unions also spend in these categories, and are not included in the graphics below.
Unsurprisingly, the NEA, AFT and other largely public-sector unions like AFSCME and the IAFF, are heavily involved in lobbying. The SEIU is also known for its political spending, like the $28 million it spent on Barack Obama's campaign in 2008.
Notably, the much smaller IUJAT and AFA, which both spend heavily on representation and organizing, each spend less than 2% of their budgets on lobbying and politics.
We can actually visualize all of this together, mapping unions onto a triangle, below, based on their spending priorities. A union which spends 100% of its budget on representation and organizing would be located at the top of the triangle, while a union that spent a third of its budget on representation, a third on grants, and a third on lobbying and overhead would be located in the middle.
While there are unions spread all over the chart, the striking pattern is just how many unions are clustered in the bottom right. Nearly all international unions spend a majority of their budgets on administration, overhead, and lobbying. There are good reasons for this, in many cases.
But some of the unions which have grown most aggressively—like the SEIU— or which are widely recognized as democratic and innovative—like UNITE HERE, the AFA, or UE—are closer to the middle. And many unions which have not seen membership growth—like IBEW, CJA, or IUOE—are in the bottom-right corner.
People Power
Money to organize and represent workers means little without the people who make unions work: officers, organizers and staff.
Unions employ vastly different numbers of staff relative to their size. The more staff a union employs—the lower its member-to-staff ratio—the better it can generally represent its workers and organize new workplaces. Unsurprisingly, very large unions like the NEA have high member-to-staff ratios (4,164 workers per staff member), while small unions like the Inlandboatmen’s Union (IBU) have very low ratios (25 workers per staff member). But even some large unions like the USW and UAW manage to keep low member-to-staff ratios, while some small unions like the Marine Engineers (MEBA) and IUJAT have ratios exceeding 3,000-to-1.
Below, unions are arranged by the average size of their locals. Unions must strike a balance between the added efficiency of pooling resources across many workers and workplaces, and the challenges in representing large numbers of workers at once.
The SEIU is by far the most centralized union, with more than 18,000 members in its average local. On the other end of the spectrum, craft unions like the Insulators (HFIA) or city-based unions like the East coast Longshoremen (ILA) have smaller locals.
Conclusion
American unions are as varied as the workers and professions they represent. They differ in their membership, their financial resources, their local union structure, their spending priorities, and their staffing levels. Uniting them, however, is their shared mission to improve the lot of the average worker, and to give people everywhere more of a say in how our society is run.
And now labor has an opportunity. Half of nonunion workers—67 million people—say they would join a union if they could, a massive increase over previous years, and public support for unions is higher than it has been in almost fifty years. To make the most of this opportunity, unions will have to organize aggressively, democratize, and learn from one another.
Some of the differences between unions are justified. Others are accidents of history. But unions can set budgets and priorities, and can partner and merge. Making these decisions strategically, and with an eye to what has worked for other unions, will be necessary to ensuring that unions and workers can win in the decades ahead.
Data provided by the Office of Labor-Management Standards, a division of the U.S. Department of Labor. Download cleaned data here.