Useful for quickly visualizing scatterplots of outcome versus predictor variables.
Usage
# S3 method for class 'ei_spec'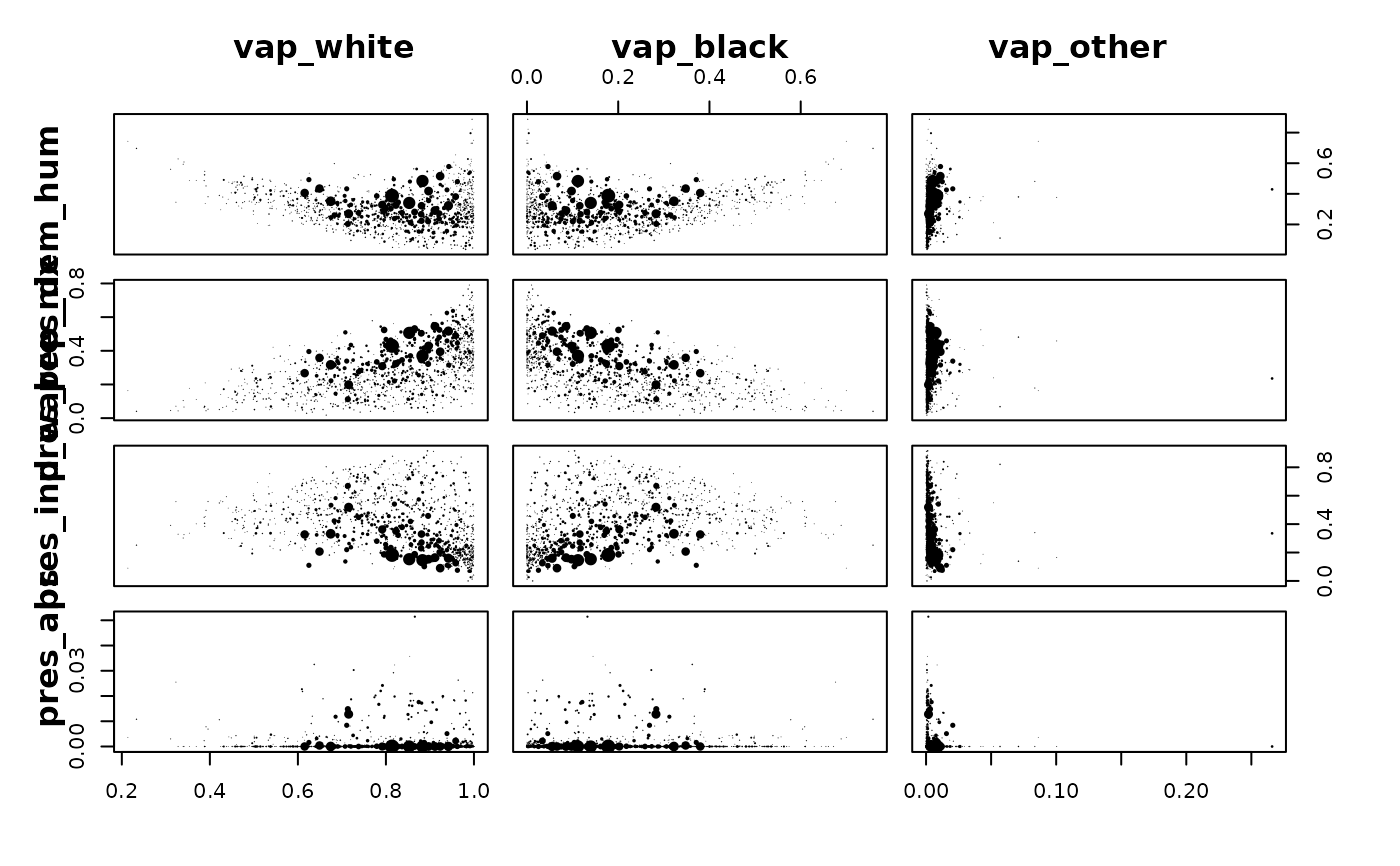
plot(x, ..., pch = 16, cex = 0.2)Useful for quickly visualizing scatterplots of outcome versus predictor variables.
# S3 method for class 'ei_spec'
plot(x, ..., pch = 16, cex = 0.2)